
- Home >
- Stock Photos >
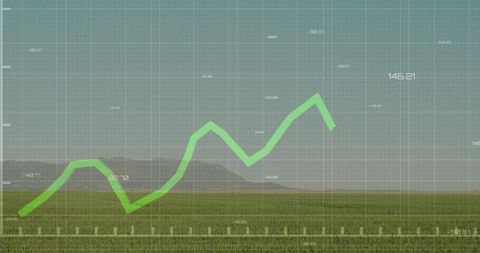
- Dynamic Financial Graph with Growth Patterns on Digital Screen
Dynamic Financial Graph with Growth Patterns on Digital Screen Image

Illustrates dynamic fluctuations in financial data through a digital line graph display. Perfect for use in financial reports, investment forecasts, business presentations, or educational materials concerning economic trends.
Powered by 


downloads
Tags:
More
Credit Photo
If you would like to credit the Photo, here are some ways you can do so
Text Link
photo Link
<span class="text-link">
<span>
<a target="_blank" href=https://pikwizard.com/photo/dynamic-financial-graph-with-growth-patterns-on-digital-screen/3a01b00a3e36dc77d49e6024866cac60/>PikWizard</a>
</span>
</span>
<span class="image-link">
<span
style="margin: 0 0 20px 0; display: inline-block; vertical-align: middle; width: 100%;"
>
<a
target="_blank"
href="https://pikwizard.com/photo/dynamic-financial-graph-with-growth-patterns-on-digital-screen/3a01b00a3e36dc77d49e6024866cac60/"
style="text-decoration: none; font-size: 10px; margin: 0;"
>
<img src="https://pikwizard.com/pw/medium/3a01b00a3e36dc77d49e6024866cac60.jpg" style="margin: 0; width: 100%;" alt="" />
<p style="font-size: 12px; margin: 0;">PikWizard</p>
</a>
</span>
</span>
Free (free of charge)
Free for personal and commercial use.
Author: Awesome Content
Similar Free Stock Images

Premium


Premium


Premium


Premium


Premium

Premium


Premium


Premium


Premium


Premium


Premium


Premium


Premium


Premium


Premium


Premium


Premium


Premium


Premium


Premium

Premium


Premium

Premium


Premium


Premium

Explore More Free Stock Images