
- Home >
- Stock Photos >
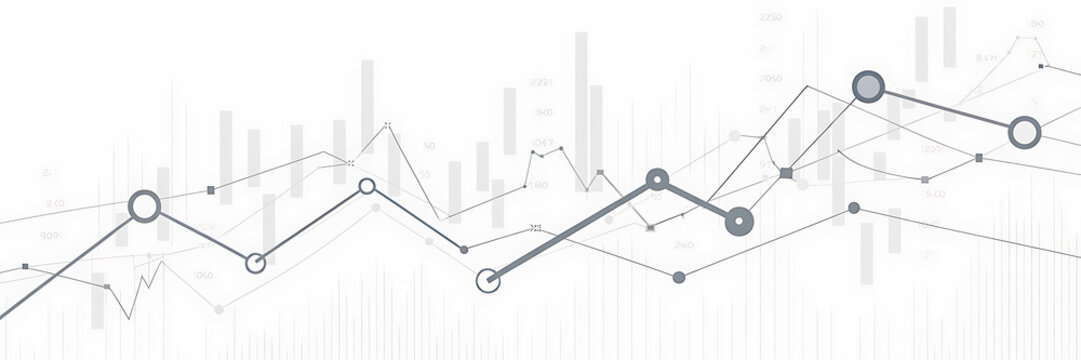
- Dynamic Financial Graphs and Dashboard Analytics
Dynamic Financial Graphs and Dashboard Analytics Image

Visualizing rising vertical bar chart alongside a white gridline chart and stock tickers on digital financial dashboard. Represents data visualization, finance technology, analytics. Perfect for presentations, articles on finance technology trends, data analysis tutorials, or business strategy sessions.
Powered by 


downloads
Tags:
More
Credit Photo
If you would like to credit the Photo, here are some ways you can do so
Text Link
photo Link
<span class="text-link">
<span>
<a target="_blank" href=https://pikwizard.com/photo/dynamic-financial-graphs-and-dashboard-analytics/a4411f60dde3bbbe7cdf73667fd8b77b/>PikWizard</a>
</span>
</span>
<span class="image-link">
<span
style="margin: 0 0 20px 0; display: inline-block; vertical-align: middle; width: 100%;"
>
<a
target="_blank"
href="https://pikwizard.com/photo/dynamic-financial-graphs-and-dashboard-analytics/a4411f60dde3bbbe7cdf73667fd8b77b/"
style="text-decoration: none; font-size: 10px; margin: 0;"
>
<img src="https://pikwizard.com/pw/medium/a4411f60dde3bbbe7cdf73667fd8b77b.jpg" style="margin: 0; width: 100%;" alt="" />
<p style="font-size: 12px; margin: 0;">PikWizard</p>
</a>
</span>
</span>
Free (free of charge)
Free for personal and commercial use.
Author: Creative Art
Similar Free Stock Images

Premium


Premium


Premium


Premium


Premium


Premium


Premium


Premium


Premium


Premium


Premium


Premium


Premium


Premium


Premium


Premium


Premium

Premium


Premium


Premium


Premium


Premium

Premium

Premium


Premium


Explore More Free Stock Images