- Home >
- Stock Photos >
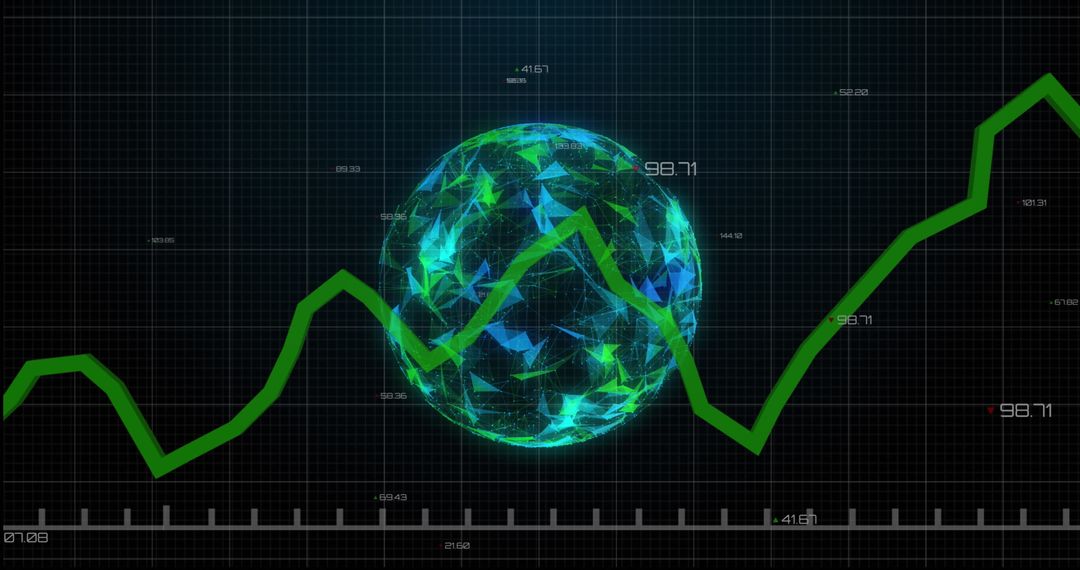
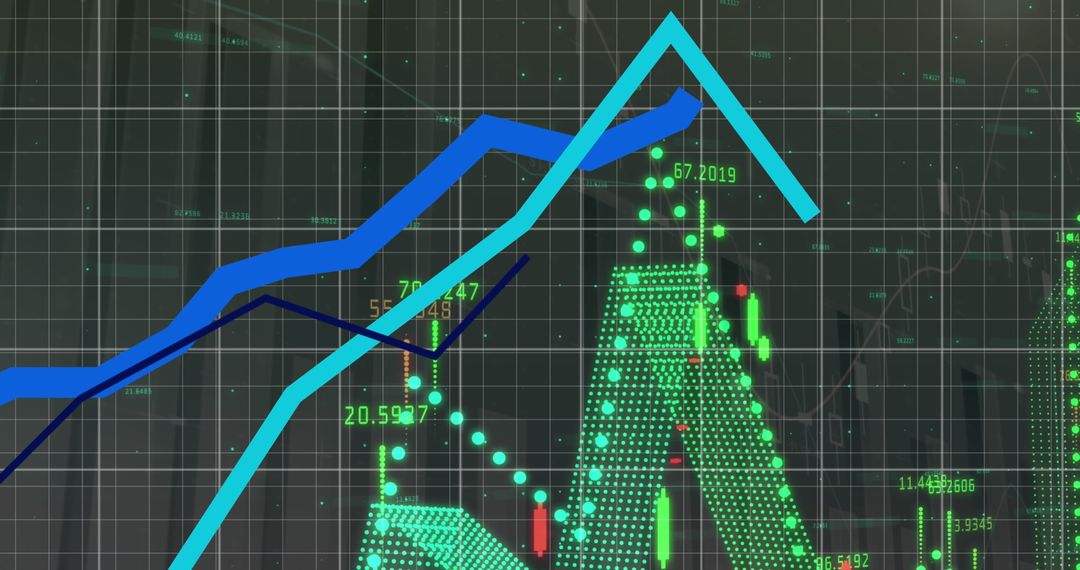
- Dynamic Global Data Insights with Trend Lines
Dynamic Global Data Insights with Trend Lines Image

Visualization features dynamic red and blue trend lines against global data processing background. Useful for illustrating concepts in finance, global data trends, business analysis, and technology advancements. Represents information flow and markets impact, suitable for financial reports, data presentations, and business strategy materials.
Powered by  - Get 15% off with code: PIKWIZARD15


2
downloads
downloads
Tags:
More
Credit Photo
If you would like to credit the Photo, here are some ways you can do so
Text Link
photo Link
<span class="text-link">
<span>
<a target="_blank" href=https://pikwizard.com/photo/dynamic-global-data-insights-with-trend-lines/323f2115c6dae029e795f30e1f98678b/>PikWizard</a>
</span>
</span>
<span class="image-link">
<span
style="margin: 0 0 20px 0; display: inline-block; vertical-align: middle; width: 100%;"
>
<a
target="_blank"
href="https://pikwizard.com/photo/dynamic-global-data-insights-with-trend-lines/323f2115c6dae029e795f30e1f98678b/"
style="text-decoration: none; font-size: 10px; margin: 0;"
>
<img src="https://pikwizard.com/pw/medium/323f2115c6dae029e795f30e1f98678b.jpg" style="margin: 0; width: 100%;" alt="" />
<p style="font-size: 12px; margin: 0;">PikWizard</p>
</a>
</span>
</span>
Free (free of charge)
Free for personal and commercial use.
Author: Creative Art
Similar Free Stock Images

Premium


Premium


Premium


Premium


Premium


Premium


Premium


Premium


Premium


Premium


Premium


Premium


Premium


Premium


Premium


Premium


Premium


Premium


Premium


Premium


Premium


Premium


Premium


Premium