
- Home >
- Stock Photos >
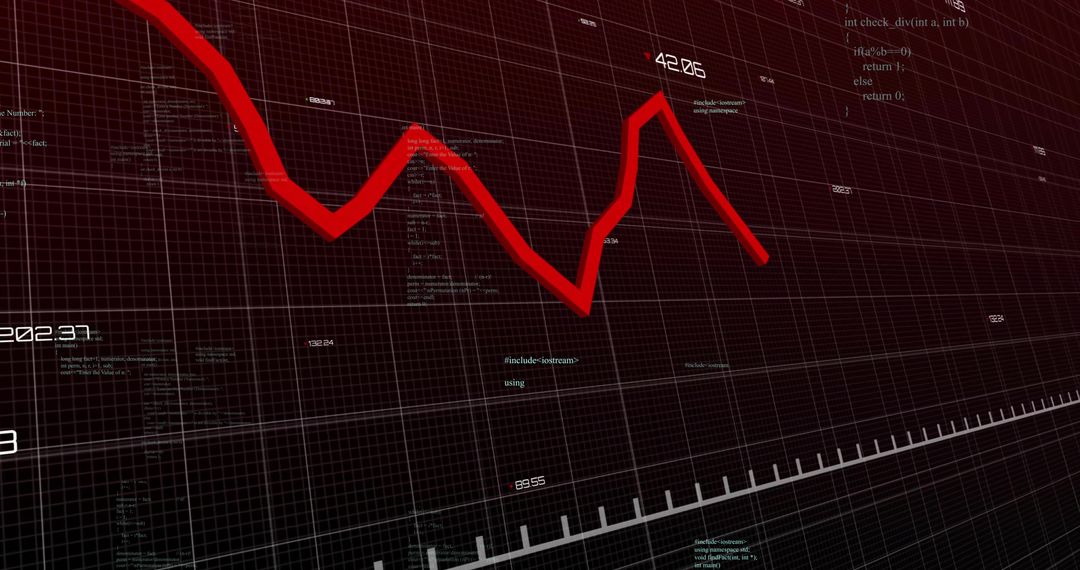
- Dynamic Graph Showing Economic Trends on Digital Grid
Dynamic Graph Showing Economic Trends on Digital Grid Image

Features red zigzag chart line on a digital grid background, symbolizing economic fluctuations. This image is ideal for financial articles, investment reports, and presentations on market trends. It vividly represents stock movements and analytics essential for economic discussions.
Powered by  - Get 15% off with code: PIKWIZARD15


0
downloads
downloads
Tags:
More
Credit Photo
If you would like to credit the Photo, here are some ways you can do so
Text Link
photo Link
<span class="text-link">
<span>
<a target="_blank" href=https://pikwizard.com/photo/dynamic-graph-showing-economic-trends-on-digital-grid/0a1c13a7b373c867b615de9360c62aab/>PikWizard</a>
</span>
</span>
<span class="image-link">
<span
style="margin: 0 0 20px 0; display: inline-block; vertical-align: middle; width: 100%;"
>
<a
target="_blank"
href="https://pikwizard.com/photo/dynamic-graph-showing-economic-trends-on-digital-grid/0a1c13a7b373c867b615de9360c62aab/"
style="text-decoration: none; font-size: 10px; margin: 0;"
>
<img src="https://pikwizard.com/pw/medium/0a1c13a7b373c867b615de9360c62aab.jpg" style="margin: 0; width: 100%;" alt="" />
<p style="font-size: 12px; margin: 0;">PikWizard</p>
</a>
</span>
</span>
Free (free of charge)
Free for personal and commercial use.
Author: Creative Art
Similar Free Stock Images

Premium


Premium


Premium


Premium


Premium


Premium


Premium


Premium


Premium


Premium


Premium


Premium


Premium


Premium


Premium


Premium


Premium


Premium


Premium


Premium


Premium


Premium


Premium


Premium

