1. Home > 
  2. Stock Photos > 
  3. Dynamic Graph with Vibrant Lines on Black Background

Dynamic Graph with Vibrant Lines on Black Background Image

Dynamic Graph with Vibrant Lines on Black Background

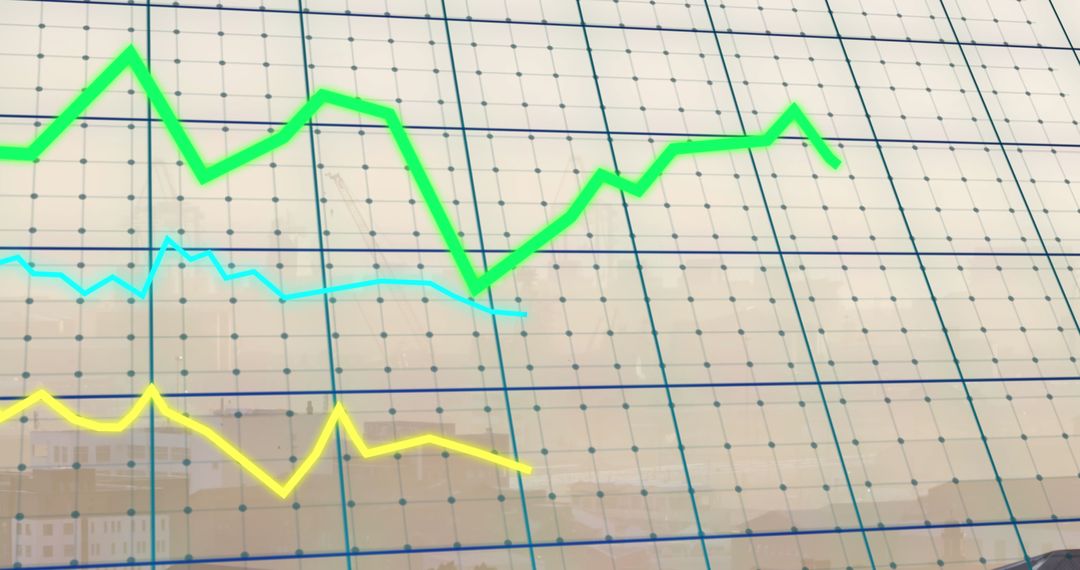
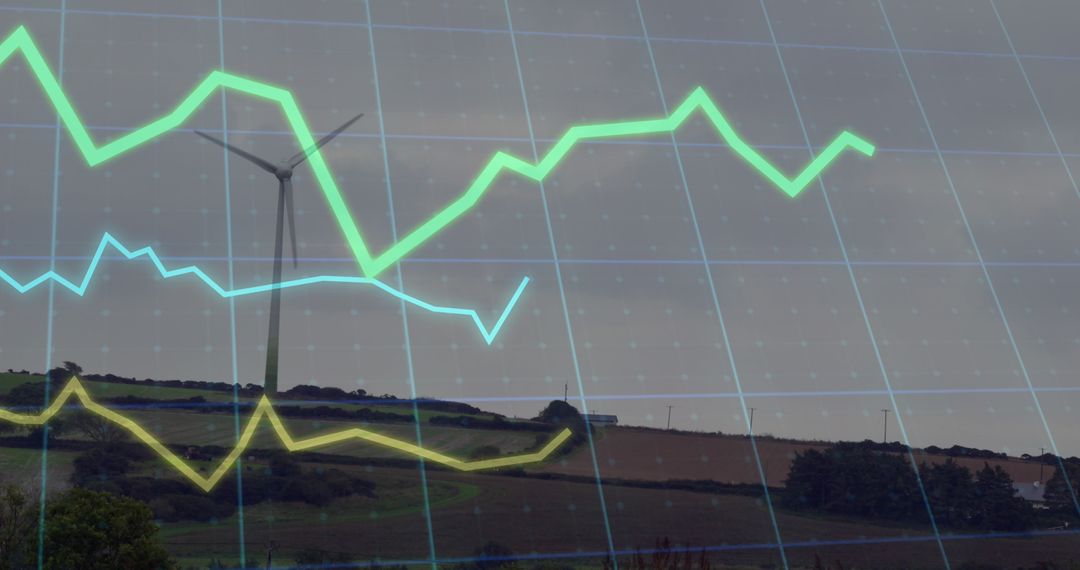
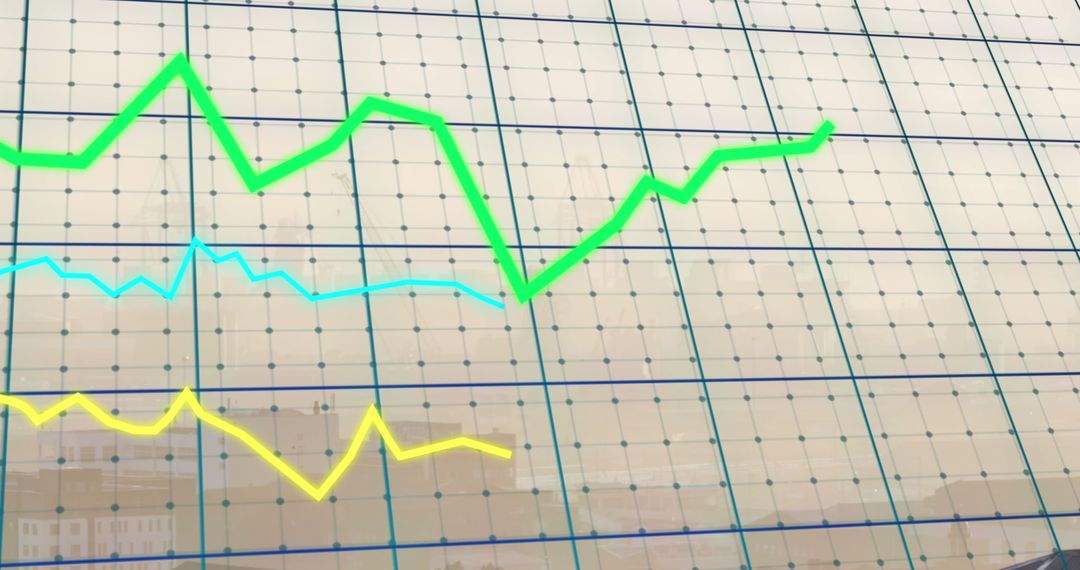
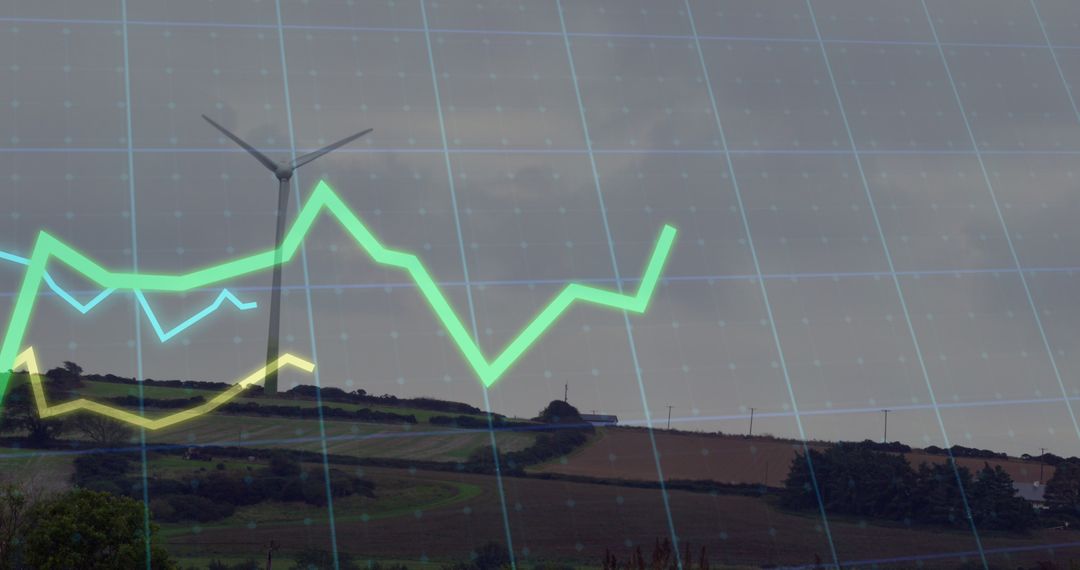
This image shows colorful, dynamic lines representing financial data analytics and market trends on a black grid background. Ideal for websites or presentations that focus on financial reports, business strategy discussions, or lectures on data visualization trends. Enhance your content focused on economic monitoring, investment analysis, and international markets with this vibrant, visually appealing graphic.

Powered by Shutterstock logo - Get 15% off with code: PIKWIZARD15
Analysis finance grow graph and market  investment. Financial  business plan,earnings,sale and strategy. Stock market chart, exchange financial growth diagram. - Powered by Shutterstock - Get 15% off with code: PIKWIZARD15Stock market or forex trading graph on touchscreen,  finance and investment concept. Economy trends for business, financial charts and digits. - Powered by Shutterstock - Get 15% off with code: PIKWIZARD15Banking business, finance and investment concept. Businessman analyzing market data, financial graph report, economic growth, business strategy, planning and solution, risk management - Powered by Shutterstock - Get 15% off with code: PIKWIZARD15Stock market or forex trading graph in futuristic concept suitable for financial investment or Economic trends business idea and all art work design. Abstract finance background - Powered by Shutterstock - Get 15% off with code: PIKWIZARD15Business man holding tablet and showing holographic graphs and stock market statistics gain profits. Concept of growth planning and business strategy. Display of good economy form digital screen. - Powered by Shutterstock - Get 15% off with code: PIKWIZARD15

Credit Photo

If you would like to credit the Photo, here are some ways you can do so

Free (free of charge)

Free for personal and commercial use.

Author: People Creations

Similar Free Stock Images

Red Declining Graph on Digital Grid Display Represents Falling Markets
Premium
Two diverse crypto traders brokers stock exchange market investors discussing trading charts research reports growth using pc computer looking at screen analyzing invest strategy, financial risks.
Analyzing Graph Showing Market Economy Stock Crisis
Financial Trends with Power Line Graphic Overlay
World Map with Falling Line Graphs Indicating Global Economic Decline
Fluctuating Financial Graph with Red Line on Green Grid
Premium
Business analysis, trading concept, Businessman, finance analyst using digital tablet, analyzing financial graph, stock market report, economic graph growth chart, business and technology background
Dynamic Financial Graph with Transparency Effect Overlay
Digital Finance: Modern Stock Market Analysis Display
Analyzing Accelerating Data Trends on Grid with Tech Insights
Dynamic Stock Market Data Amid Empty Office Setting
Premium
Business strategy development and growing growth plan.	
Financial management strategy for business growth.Graph and chart. Investment of growth on currency rate.
Financial Data Overlay on Windmill Landscape
Digital Financial Data Graph Showcasing Market Trends
Growth Trend with Green Line Overlay and Modern Cityscape
Digital Stock Market Green Graph Against Dark Trading Board
Premium
Stock market analysis, business, finance and investment. Finance analyst analyzing stock market trading graph, economic growth chart, planning and strategy, business investment with financial report
Networking Graph Overlay Data Server Room Visualization
Financial Graphs Overlay Virtual Data Office Computers
Dynamic Stock Market Visual in Modern Office Setting
Colorful Line Graphs Depicting Fluctuating Financial Trends
Premium
Businessman works on laptop Showing business analytics dashboard with charts, metrics, and KPI to analyze performance and create insight reports for operations management. Data analysis concept.Ai
Fluctuating Financial Graph on Green Grid Background
Global Finance and Data Analytics in Server Environment
Dynamic Stock Market Chart with Fluctuating Trends and Data Points
Fluctuating Stock Market Graph with Dramatic Peaks
Premium
Financial advisor explaining invest stock market data consulting investor. Two busy business men analysts doing finance trading analysis pointing at exchange chart on laptop screen working in office.
Futuristic Neon Green Data Visualization on Grid Background
Tri-Color Line Graph Overlaying Blurred Railway Scene
Business Professional Analyzing Data on Desktop with Line Graph Overlay
Futuristic HUD Facial Recognition Avatar with Neon Waveform Analytics and Grid Interface
Digital Financial Data Chart with Modern City Skyscrapers
Line Graphs on Digital Background Show Financial Data Trends
Premium
Investors analyze the data stock market index via smartphone screen to trade the stock chart for planning investments take profit, trade stock exchange market and cryptocurrency data, financial.
Energy Efficiency with Data Analytics and Smart Infrastructure
Global Economic Trends Highlighted on World Map with Graphs
Dynamic Line Chart with Histogram on Digital Grid Background
Stock Market Trends and Data Analysis
Premium
Business finance data analytics graph chart report, man using laptop computer hand typing investment data digital marketing KPI sale report, financial management technology, cyber space metaverse.
Financial Data Charts in Shimmering Blue Digital Space
Financial Growth Chart Overlay on City Skyline
Financial Graph Analysis on Green Grid Background
Dynamic Glowing Digital Graphs on 3D Grid Background
Premium
Finance trade manager analysing stock market indicators for best investment strategy, financial data and charts with business buildings in background
Analyzing Stock Market Trends with Dynamic Graphs and Data
Dynamic Financial Data Chart Display with Graphical Analysis
Financial Graphs Displaying Business Trends on Grid Background
Financial Graphs with Social Media Analytics on Digital Chart
Premium
Trader analyzing data on virtual screen.Price graph and indicator. Stock market invest and crypto currency. Stock market and business investment.
Financial Data Graph Overlay on Modern Office Background
Dynamic Financial Graphs and Data Analysis Interface
Global Networking Concept with 6G Technology Display
Green Line Graph with Data Points on Grid Background
Premium
Analysis finance graph and market chart investment.Trade technology, and investment analysis.Big data chart on city backdrop.Business development, financial plan and strategy.
Financial Graph with Data Analysis and Market Statistics
Financial Growth Stock Nikkei in Urban City Skyline
Dynamic Stock Market Analysis with Digital Graph Lines
Red Line Graph on Digital Grid Background for Analytics
Premium
hand show graph chart stock market economic. growth business concept. plan strategy company increase profit to success global. trend marketing grows technology digital. economy, financial, and invest
Digital Finance Dashboard Showing Candlestick and Line Charts
Financial Dashboard with Line and Bar Graphs for Market Analysis
Neon Social Media Analytics Line Chart with Engagement Bubbles Showing Likes Comments
Falling Market Trend with Empty Classroom Background
Graph Lines Portraying Financial Data Trends
Financial Data Analysis with Digital Grid Chart
Premium
Real estate, development and investing concept with financial chart indicators and stock market graphs on city skyscrapers tops bottom view, double exposure
Fluctuating Graph on Green Grid Background Illustrating Financial Trends
Falling Line Graph on Navy Background Illustrating Economic Decline
Digital Representation of Inflation with Financial Data Overlay
Global Economy Displaying Growth Trends with Ukraine-NATO Financial Outlook
Premium
Analyst working with Financial Data and Business Analytics Dashboard on computer to make Financial Report with KPI and Metrics. Investment, Corporate Finance, Strategy, Operations, Sales.
Financial Data Line Graph on Digital Display
Dynamic Data Graphs on Digital Interface Background
Futuristic Digital Interface with Dynamic Financial Graph
Social Media Activity Icons on Digital Graph
Premium
Businesswomen use magnifier glass find stock in stock markets, uptrends, growth economics, business strategy development, and opportunities for investment, take profit from funds, Financial Analyst.
Dynamic Business Data and Cityscape Visualization
Dynamic Forex Trading Graphs with Increasing Numbers
Rising Financial Data Graph on Digital Grid Background
Analyzing Financial Charts on Digital Screen
Premium
Stock Market Chart on Blue Background. share drop down
Dynamic Financial Data Graphs with Holographic Styles
Financial Data Analysis Vibrant Graphs on Blue Background
Green Line Graph Depicting Sustainability and Environmental Icons
Digital Data Visualization Over Server Rows
Premium
Businessman analyzing forex trading graph financial data. Stock Market Investments Funds and Digital Assets. Business finance technology and investment concept. Business finance background.
Armenian Flag with Financial Graph Overlay Depicting Market Trends
Digital Stock Market Graph Red Trendline on Green Background
NFT Concept with Dynamic Line Graphs on Digital Grid Background
Colorful Data Line Graphs on Digital Circuit Interface
Premium
Stock graph and financial chart. Analyze stock market finance volume of stock market with Graph and chart holograph technology. High quality photo
Dynamic Financial Data Visualization Dashboard with Global Elements
Glowing Neon Red Global Trend Line Chart Showing Market Fluctuations on Digital World Map
Financial Data Displayed Over City Skyline with Rising Graphs
Dynamic Financial Market Trends with Data Visualizations
Financial Data Visualization with Rising Trends
Wind Turbines and Financial Graph Fusion
Premium
Stock exchange market graph analysis background
Rising Digital Graph and Data Visualizations on Black Background
Dynamic Inflation Rate Visualization with Code Overlay
Data Processing and Stagflation Concept with NATO Emblem
Fluctuating Digital Stock Market Data Chart
Premium
Smart businessman hand close up NFT financial data on mobile laptop futuristic stock chart graphic, Business investor stock exchange market and crypto currency data analytics digital technology
Abstract Digital Graph and Code on Violet Background
Dynamic Data Visualization and Financial Growth Curves
Dynamic Financial Growth Digital Chart Display
Dynamic Stock Market Graphs Over Digital Interface
Premium
Businessman using laptop computer analyzing sales data and financial growth graph chart report. Business planning, strategy and development. Financial accounting. market research, data analysis
Rising Graph Line on Digital Green Grid Background
Dynamic Data Chart on Dark Digital Background
Financial Data Analysis Over Green Grid Background
Data Analytics and Business Strategy Network Interface
Premium
Businessman draws  increase arrow graph corporate future growth year 2021 to 2022.   Development to success and motivation.
Dynamic Red Line Graph Over Green Grid Background
Dynamic Financial Data Overlaid on Grid Background
Abstract Financial Data Processing and Analysis Interface
Financial Stock Market Data Visualization with Declining Trends
Premium
Businessman using pen touch candle chart financial growth of business and world economy. Stock market price increase. Stock market investment analysis, financial risk management and investment.
Futuristic Growth Hacking Data Analytics Concept
Financial Growth Chart Over Ocean with Green Grid Overlay
Dynamic Financial Data Analytics with Interactive Visual Elements
Futuristic Energy Tracking with Rocket Blueprint and Data Analytics
Premium
Stock market analysis, notebooks, laptops,ai creates images
Neon Green Line Graph Pulsing on Futuristic Blue Grid Dashboard for Data Analytics