
- Home >
- Stock Photos >
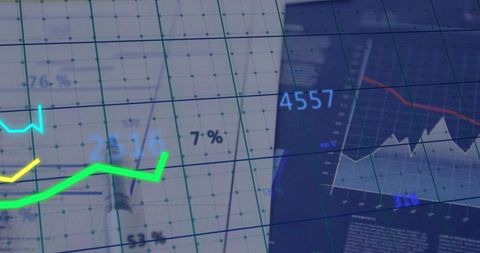
- Dynamic Line Charts on Digital Trading Interface
Dynamic Line Charts on Digital Trading Interface Image

Illustration showcases colorful line charts displaying fluctuating trends on a trading screen. Perfect for use in presentations, articles, and websites related to finance, stock analysis, digital technology, or data visualization concepts.
Powered by 


downloads
Tags:
More
Credit Photo
If you would like to credit the Photo, here are some ways you can do so
Text Link
photo Link
<span class="text-link">
<span>
<a target="_blank" href=https://pikwizard.com/photo/dynamic-line-charts-on-digital-trading-interface/78fd1d8ae8d15eb4bcd41c89f8a69a91/>PikWizard</a>
</span>
</span>
<span class="image-link">
<span
style="margin: 0 0 20px 0; display: inline-block; vertical-align: middle; width: 100%;"
>
<a
target="_blank"
href="https://pikwizard.com/photo/dynamic-line-charts-on-digital-trading-interface/78fd1d8ae8d15eb4bcd41c89f8a69a91/"
style="text-decoration: none; font-size: 10px; margin: 0;"
>
<img src="https://pikwizard.com/pw/medium/78fd1d8ae8d15eb4bcd41c89f8a69a91.jpg" style="margin: 0; width: 100%;" alt="" />
<p style="font-size: 12px; margin: 0;">PikWizard</p>
</a>
</span>
</span>
Free (free of charge)
Free for personal and commercial use.
Author: People Creations
Similar Free Stock Images

Premium


Premium


Premium


Premium


Premium

Premium


Premium


Premium

AI


Premium


Premium


Premium


Premium

Premium


Premium


Premium


Premium


Premium


Premium


Premium


Premium


Premium

Premium


Premium


Premium


Premium


Explore More Free Stock Images