- Home >
- Stock Photos >
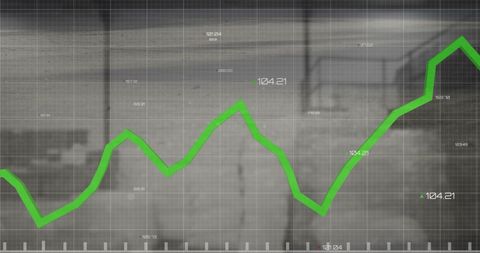
- Dynamic Line Graph Displaying Data Trends on Beige Grid Background
Dynamic Line Graph Displaying Data Trends on Beige Grid Background Image

Visual representation of statistical data through an angular line graph on a grid, ideal for reports, presentations, and articles discussing data analytics, market trends, or technology trends, helps emphasize insights and progress measurement.
Powered by  - Get 15% off with code: PIKWIZARD15


downloads
Tags:
More
Credit Photo
If you would like to credit the Photo, here are some ways you can do so
Text Link
photo Link
<span class="text-link">
<span>
<a target="_blank" href=https://pikwizard.com/photo/dynamic-line-graph-displaying-data-trends-on-beige-grid-background/0017a75dba1e0c5566dd5dc47c920ae6/>PikWizard</a>
</span>
</span>
<span class="image-link">
<span
style="margin: 0 0 20px 0; display: inline-block; vertical-align: middle; width: 100%;"
>
<a
target="_blank"
href="https://pikwizard.com/photo/dynamic-line-graph-displaying-data-trends-on-beige-grid-background/0017a75dba1e0c5566dd5dc47c920ae6/"
style="text-decoration: none; font-size: 10px; margin: 0;"
>
<img src="https://pikwizard.com/pw/medium/0017a75dba1e0c5566dd5dc47c920ae6.jpg" style="margin: 0; width: 100%;" alt="" />
<p style="font-size: 12px; margin: 0;">PikWizard</p>
</a>
</span>
</span>
Free (free of charge)
Free for personal and commercial use.
Author: Awesome Content
Similar Free Stock Images
Loading...