
- Home >
- Stock Photos >
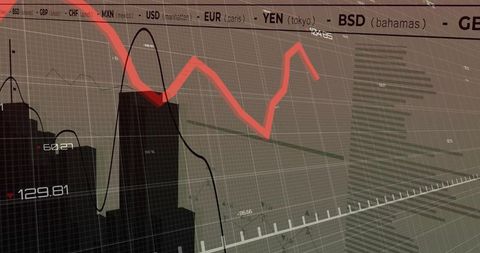
- Dynamic Red Line Graph Display in Digital Interface
Dynamic Red Line Graph Display in Digital Interface Image

Shows a dynamic red line graph on a digital display, suitable for presentations on financial trends or data visualization. Ideal for use in analytics reports, stock market updates, or illustrating technological innovation in software interfaces. Useful for demonstrating concepts in corporate environments, finance education, or technology-related marketing materials.
Powered by 


downloads
Tags:
More
Credit Photo
If you would like to credit the Photo, here are some ways you can do so
Text Link
photo Link
<span class="text-link">
<span>
<a target="_blank" href=https://pikwizard.com/photo/dynamic-red-line-graph-display-in-digital-interface/c4799c1cd32444ca1b2029a4e98244d7/>PikWizard</a>
</span>
</span>
<span class="image-link">
<span
style="margin: 0 0 20px 0; display: inline-block; vertical-align: middle; width: 100%;"
>
<a
target="_blank"
href="https://pikwizard.com/photo/dynamic-red-line-graph-display-in-digital-interface/c4799c1cd32444ca1b2029a4e98244d7/"
style="text-decoration: none; font-size: 10px; margin: 0;"
>
<img src="https://pikwizard.com/pw/medium/c4799c1cd32444ca1b2029a4e98244d7.jpg" style="margin: 0; width: 100%;" alt="" />
<p style="font-size: 12px; margin: 0;">PikWizard</p>
</a>
</span>
</span>
Free (free of charge)
Free for personal and commercial use.
Author: People Creations
Similar Free Stock Images

Premium


Premium


Premium

Premium


Premium


Premium


Premium


Premium


Premium


Premium


Premium


Premium

Premium

Premium


Premium


Premium

Premium


Premium

Premium


Premium

Premium


Premium


Premium


Premium


Premium


Explore More Free Stock Images