
- Home >
- Stock Photos >
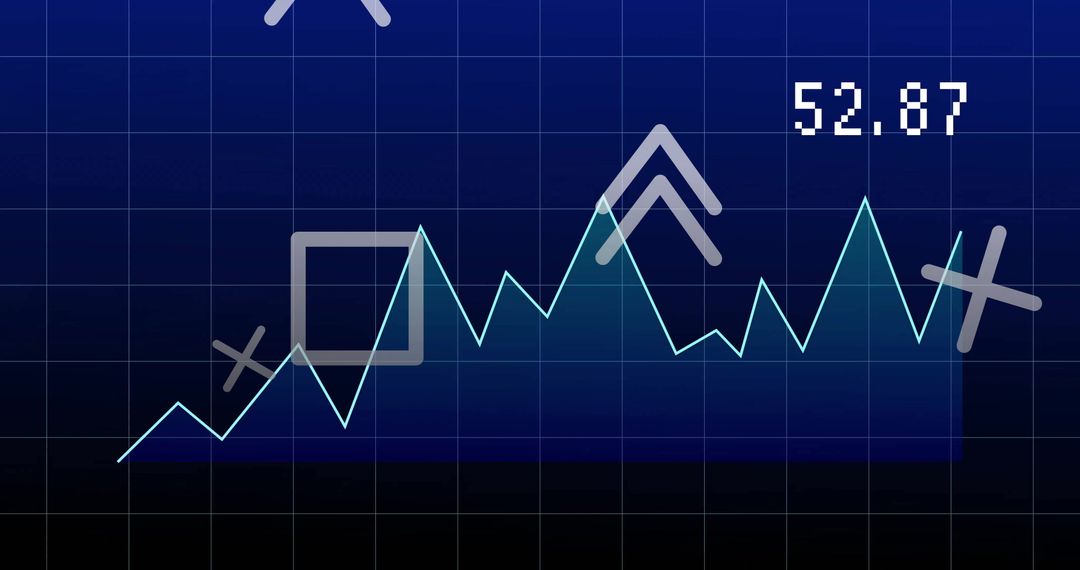
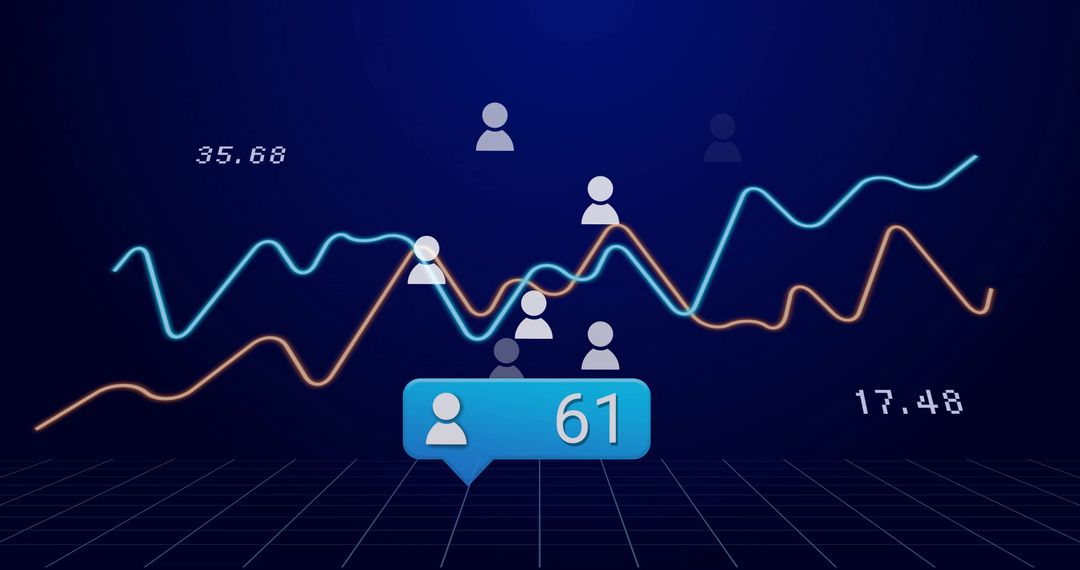
- Dynamic Social Media Analytics with Digital Line Graphs
Dynamic Social Media Analytics with Digital Line Graphs Image
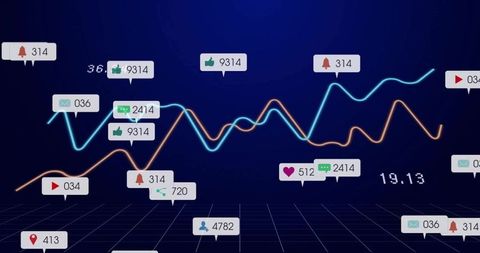
Visualizer perfect for depicting trends in social media analytics on a digital dashboard. Use in presentations focused on data insights or tech strategy, demonstrating activity metrics such as likes, comments, and notifications over time. Ideal for illustrating concepts of data visualization and trend analysis in digital marketing.
Powered by  - Get 15% off with code: PIKWIZARD15


0
downloads
downloads
Tags:
More
Credit Photo
If you would like to credit the Photo, here are some ways you can do so
Text Link
photo Link
<span class="text-link">
<span>
<a target="_blank" href=https://pikwizard.com/photo/dynamic-social-media-analytics-with-digital-line-graphs/895229e1424e78f8e0ab3a3f33928d64/>PikWizard</a>
</span>
</span>
<span class="image-link">
<span
style="margin: 0 0 20px 0; display: inline-block; vertical-align: middle; width: 100%;"
>
<a
target="_blank"
href="https://pikwizard.com/photo/dynamic-social-media-analytics-with-digital-line-graphs/895229e1424e78f8e0ab3a3f33928d64/"
style="text-decoration: none; font-size: 10px; margin: 0;"
>
<img src="https://pikwizard.com/pw/medium/895229e1424e78f8e0ab3a3f33928d64.jpg" style="margin: 0; width: 100%;" alt="" />
<p style="font-size: 12px; margin: 0;">PikWizard</p>
</a>
</span>
</span>
Free (free of charge)
Free for personal and commercial use.
Author: Authentic Images
Similar Free Stock Images

Premium


Premium


Premium


Premium


Premium


Premium


Premium


Premium


Premium


Premium


Premium


Premium


Premium


Premium


Premium


Premium


Premium


Premium


Premium


Premium


Premium


Premium


Premium


Premium
