- Home >
- Stock Photos >
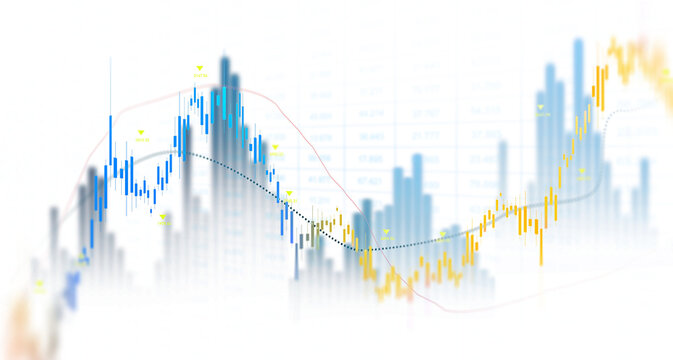
- Dynamic Stock Market Analytics with Digital Financial Graphs
Dynamic Stock Market Analytics with Digital Financial Graphs Image

Digital representation of the stock market depicting fluctuating financial data against a sophisticated blue backdrop. Useful for illustrating concepts related to business technology, finance analytics, and global economy discussions in presentations or articles.
Powered by 


2
downloads
downloads
Tags:
More
Credit Photo
If you would like to credit the Photo, here are some ways you can do so
Text Link
photo Link
<span class="text-link">
<span>
<a target="_blank" href=https://pikwizard.com/photo/dynamic-stock-market-analytics-with-digital-financial-graphs/4454fca144b42e2c27541b83f6f6177c/>PikWizard</a>
</span>
</span>
<span class="image-link">
<span
style="margin: 0 0 20px 0; display: inline-block; vertical-align: middle; width: 100%;"
>
<a
target="_blank"
href="https://pikwizard.com/photo/dynamic-stock-market-analytics-with-digital-financial-graphs/4454fca144b42e2c27541b83f6f6177c/"
style="text-decoration: none; font-size: 10px; margin: 0;"
>
<img src="https://pikwizard.com/pw/medium/4454fca144b42e2c27541b83f6f6177c.jpg" style="margin: 0; width: 100%;" alt="" />
<p style="font-size: 12px; margin: 0;">PikWizard</p>
</a>
</span>
</span>
Free (free of charge)
Free for personal and commercial use.
Author: Creative Art
Similar Free Stock Images

Premium


Premium


Premium


Premium


Premium


Premium


Premium


Premium


Premium


Premium


Premium


Premium


Premium


Premium


Premium


Premium


Premium


Premium


Premium


Premium


Premium


Premium


Premium


Premium