
- Home >
- Stock Photos >
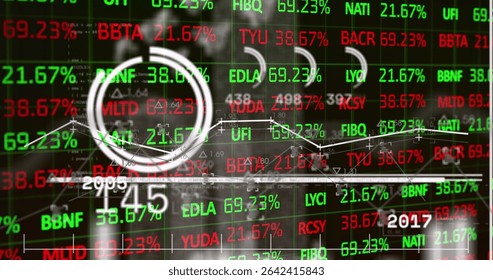
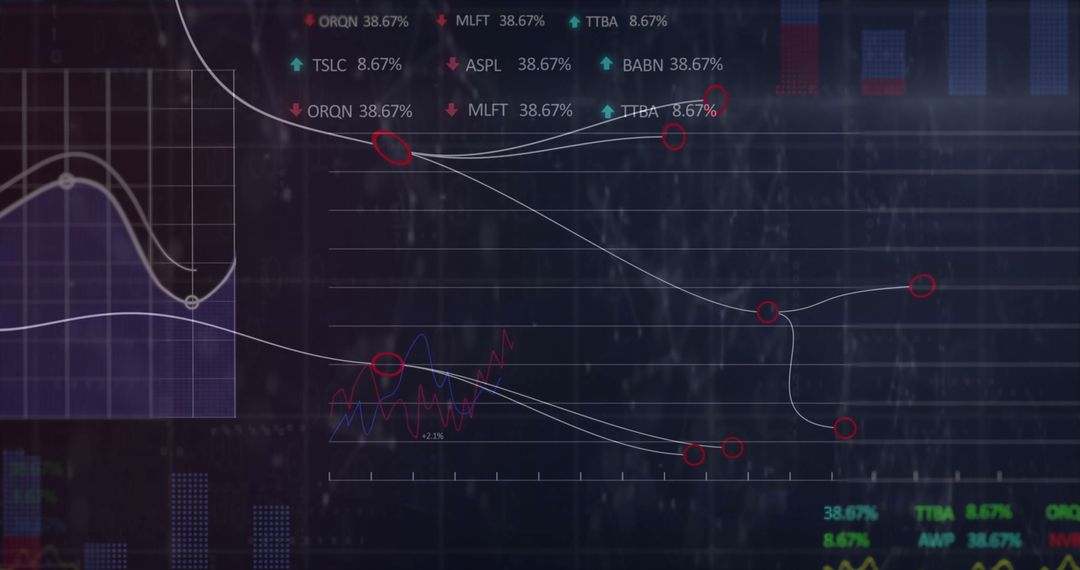
- Dynamic Stock Market Dashboard with Graph and Charts
Dynamic Stock Market Dashboard with Graph and Charts Image

An immersive visual showcasing dynamic graphs fluctuating on a trading dashboard, ideal for financial technology and analytics content. This image demonstrates advanced data visualization, merging modern digital interface design with clear financial analytics, perfect for web assets, presentation slides, or promotional material for financial services interested in displaying their technological expertise or new platforms.
Powered by  - Get 15% off with code: PIKWIZARD15


0
downloads
downloads
Tags:
More
Credit Photo
If you would like to credit the Photo, here are some ways you can do so
Text Link
photo Link
<span class="text-link">
<span>
<a target="_blank" href=https://pikwizard.com/photo/dynamic-stock-market-dashboard-with-graph-and-charts/94bfad03eb51853f29df5839732d31e1/>PikWizard</a>
</span>
</span>
<span class="image-link">
<span
style="margin: 0 0 20px 0; display: inline-block; vertical-align: middle; width: 100%;"
>
<a
target="_blank"
href="https://pikwizard.com/photo/dynamic-stock-market-dashboard-with-graph-and-charts/94bfad03eb51853f29df5839732d31e1/"
style="text-decoration: none; font-size: 10px; margin: 0;"
>
<img src="https://pikwizard.com/pw/medium/94bfad03eb51853f29df5839732d31e1.jpg" style="margin: 0; width: 100%;" alt="" />
<p style="font-size: 12px; margin: 0;">PikWizard</p>
</a>
</span>
</span>
Free (free of charge)
Free for personal and commercial use.
Author: Authentic Images
Similar Free Stock Images

Premium


Premium


Premium


Premium


Premium


Premium


Premium


Premium


Premium


Premium


Premium


Premium


Premium


Premium


Premium


Premium


Premium


Premium


Premium


Premium


Premium


Premium


Premium


Premium

