- Home >
- Stock Photos >
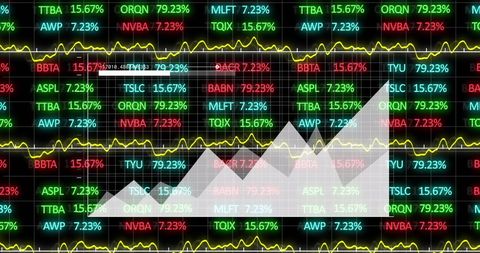
- Dynamic Stock Market Graph with Data Metrics Background
Dynamic Stock Market Graph with Data Metrics Background Image

Digital depiction of a stock market environment showing a fluctuating green trend line among financial data figures. Provides insight into real-time market analysis and trading patterns, ideal for use in finance-related presentations, market strategy materials, or financial blog articles looking into market dynamics and investment strategies.
Powered by 


downloads
Tags:
More
Credit Photo
If you would like to credit the Photo, here are some ways you can do so
Text Link
photo Link
<span class="text-link">
<span>
<a target="_blank" href=https://pikwizard.com/photo/dynamic-stock-market-graph-with-data-metrics-background/d2d3d999d489a3af28e006e43870a28f/>PikWizard</a>
</span>
</span>
<span class="image-link">
<span
style="margin: 0 0 20px 0; display: inline-block; vertical-align: middle; width: 100%;"
>
<a
target="_blank"
href="https://pikwizard.com/photo/dynamic-stock-market-graph-with-data-metrics-background/d2d3d999d489a3af28e006e43870a28f/"
style="text-decoration: none; font-size: 10px; margin: 0;"
>
<img src="https://pikwizard.com/pw/medium/d2d3d999d489a3af28e006e43870a28f.jpg" style="margin: 0; width: 100%;" alt="" />
<p style="font-size: 12px; margin: 0;">PikWizard</p>
</a>
</span>
</span>
Free (free of charge)
Free for personal and commercial use.
Author: Authentic Images
Similar Free Stock Images
Loading...

Premium


Premium


Premium


Premium


Premium


Premium


Premium

Premium


Premium

Premium


Premium


Premium

Premium


Premium

Premium


Premium


Premium


Premium


Premium


Premium


Premium

Premium

Premium


Premium


Premium