- Home >
- Stock Photos >
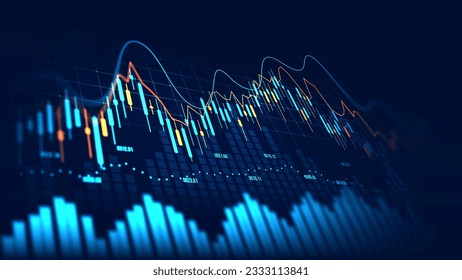
- Dynamic Stock Market Graphs and Tickers Displaying Performance
Dynamic Stock Market Graphs and Tickers Displaying Performance Image

Dynamic visualization of stock market graphs showing fluctuating prices and tickers against a black background. Useful for articles on financial trends, market analysis reports, or investment guides, conveying movement in market indices or financial data conferences.
Powered by  - Get 15% off with code: PIKWIZARD15


downloads
Tags:
More
Credit Photo
If you would like to credit the Photo, here are some ways you can do so
Text Link
photo Link
<span class="text-link">
<span>
<a target="_blank" href=https://pikwizard.com/photo/dynamic-stock-market-graphs-and-tickers-displaying-performance/e791b6a15e7834b963bca66a100c9076/>PikWizard</a>
</span>
</span>
<span class="image-link">
<span
style="margin: 0 0 20px 0; display: inline-block; vertical-align: middle; width: 100%;"
>
<a
target="_blank"
href="https://pikwizard.com/photo/dynamic-stock-market-graphs-and-tickers-displaying-performance/e791b6a15e7834b963bca66a100c9076/"
style="text-decoration: none; font-size: 10px; margin: 0;"
>
<img src="https://pikwizard.com/pw/medium/e791b6a15e7834b963bca66a100c9076.jpg" style="margin: 0; width: 100%;" alt="" />
<p style="font-size: 12px; margin: 0;">PikWizard</p>
</a>
</span>
</span>
Free (free of charge)
Free for personal and commercial use.
Author: Authentic Images
Similar Free Stock Images
Loading...

Premium


Premium


Premium


Premium


Premium


Premium


Premium


Premium


Premium
Premium


Premium


Premium

Premium


Premium

Premium


Premium

Premium


Premium


Premium


Premium


Premium


Premium

Premium

Premium


Premium