
- Home >
- Stock Photos >
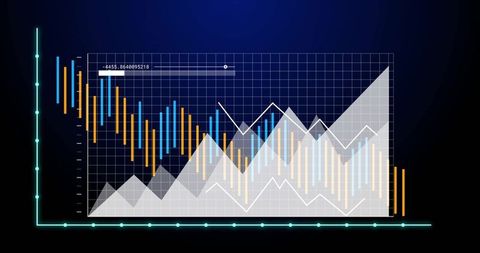
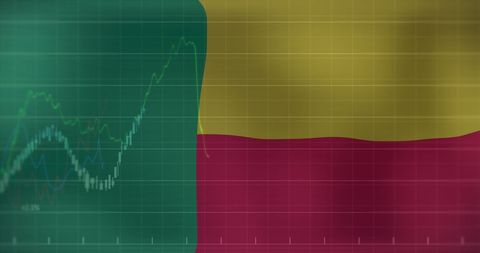
- Economic Data Analysis Graph over Gabon Flag Background
Economic Data Analysis Graph over Gabon Flag Background Image
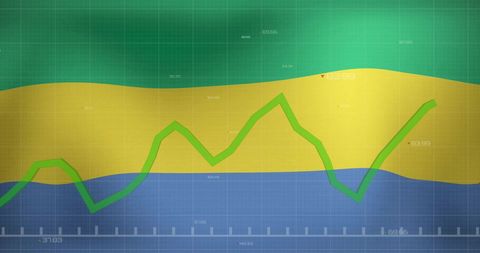
This graphic displays a data analysis graph overlaying the national flag of Gabon. It represents financial trends and economic data visualization, suggesting areas of national economic growth and performance. Useful for illustrating economic reports, supporting investment presentations focused on Gabon, or enhancing news articles about economic progress and business opportunities in the region.
Powered by  - Get 15% off with code: PIKWIZARD15


2
downloads
downloads
Tags:
More
Credit Photo
If you would like to credit the Photo, here are some ways you can do so
Text Link
photo Link
<span class="text-link">
<span>
<a target="_blank" href=https://pikwizard.com/photo/economic-data-analysis-graph-over-gabon-flag-background/5deb8f5320e592779f93401208bedd85/>PikWizard</a>
</span>
</span>
<span class="image-link">
<span
style="margin: 0 0 20px 0; display: inline-block; vertical-align: middle; width: 100%;"
>
<a
target="_blank"
href="https://pikwizard.com/photo/economic-data-analysis-graph-over-gabon-flag-background/5deb8f5320e592779f93401208bedd85/"
style="text-decoration: none; font-size: 10px; margin: 0;"
>
<img src="https://pikwizard.com/pw/medium/5deb8f5320e592779f93401208bedd85.jpg" style="margin: 0; width: 100%;" alt="" />
<p style="font-size: 12px; margin: 0;">PikWizard</p>
</a>
</span>
</span>
Free (free of charge)
Free for personal and commercial use.
Author: People Creations
Similar Free Stock Images

Premium


Premium


Premium


Premium


Premium


Premium


Premium


