- Home >
- Stock Photos >
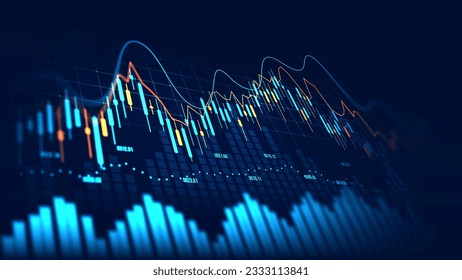
- Economic Trends Analysis with Financial Indicators and Graphs
Economic Trends Analysis with Financial Indicators and Graphs Image

Visual representation of economic techniques with various financial indicators and terminology. Incorporates concepts like GDP growth, inflation, and investment, supporting businesses, educational materials, or financial presentations highlighting market analysis and international economic strategies.
Powered by  - Get 15% off with code: PIKWIZARD15


2
downloads
downloads
Tags:
More
Credit Photo
If you would like to credit the Photo, here are some ways you can do so
Text Link
photo Link
<span class="text-link">
<span>
<a target="_blank" href=https://pikwizard.com/photo/economic-trends-analysis-with-financial-indicators-and-graphs/33f48c4ed8a7e6915f88b1166eed71bf/>PikWizard</a>
</span>
</span>
<span class="image-link">
<span
style="margin: 0 0 20px 0; display: inline-block; vertical-align: middle; width: 100%;"
>
<a
target="_blank"
href="https://pikwizard.com/photo/economic-trends-analysis-with-financial-indicators-and-graphs/33f48c4ed8a7e6915f88b1166eed71bf/"
style="text-decoration: none; font-size: 10px; margin: 0;"
>
<img src="https://pikwizard.com/pw/medium/33f48c4ed8a7e6915f88b1166eed71bf.jpg" style="margin: 0; width: 100%;" alt="" />
<p style="font-size: 12px; margin: 0;">PikWizard</p>
</a>
</span>
</span>
Free (free of charge)
Free for personal and commercial use.
Author: People Creations
Similar Free Stock Images

Premium


Premium


Premium


Premium


Premium


Premium


Premium


Premium


Premium


Premium


Premium


Premium


Premium


Premium


Premium


Premium


Premium


Premium


Premium


Premium


Premium


Premium


Premium


Premium


Premium