
- Home >
- Stock Photos >
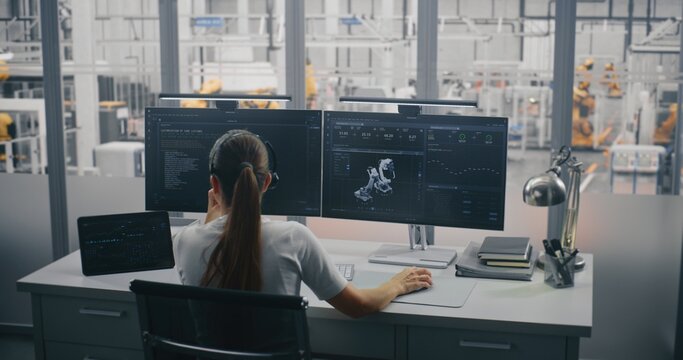
- Engineer Analyzing Data with Digital Overlay in Server Room
Engineer Analyzing Data with Digital Overlay in Server Room Image

Female engineer using a tablet has digital data graph overlay in server room. Ideal for illustrating concepts of digital transformation, IT infrastructure, and data analysis in technological contexts. Can be used in articles on cloud computing, IT careers, and cybersecurity advancements.
Powered by 


downloads
Tags:
More
Credit Photo
If you would like to credit the Photo, here are some ways you can do so
Text Link
photo Link
<span class="text-link">
<span>
<a target="_blank" href=https://pikwizard.com/photo/engineer-analyzing-data-with-digital-overlay-in-server-room/3b0dca1eba9517bc90ba76ed99ba7536/>PikWizard</a>
</span>
</span>
<span class="image-link">
<span
style="margin: 0 0 20px 0; display: inline-block; vertical-align: middle; width: 100%;"
>
<a
target="_blank"
href="https://pikwizard.com/photo/engineer-analyzing-data-with-digital-overlay-in-server-room/3b0dca1eba9517bc90ba76ed99ba7536/"
style="text-decoration: none; font-size: 10px; margin: 0;"
>
<img src="https://pikwizard.com/pw/medium/3b0dca1eba9517bc90ba76ed99ba7536.jpg" style="margin: 0; width: 100%;" alt="" />
<p style="font-size: 12px; margin: 0;">PikWizard</p>
</a>
</span>
</span>
Free (free of charge)
Free for personal and commercial use.
Author: Creative Art
Similar Free Stock Images

Premium


Premium


Premium


Premium

Premium


Premium


Premium


Premium

Premium


Premium


Premium


Premium


Premium


Premium

Premium

Premium


Premium


Premium


Premium


Premium


Premium


Premium


Premium


Premium
Premium


Explore More Free Stock Images