- Home >
- Stock Photos >
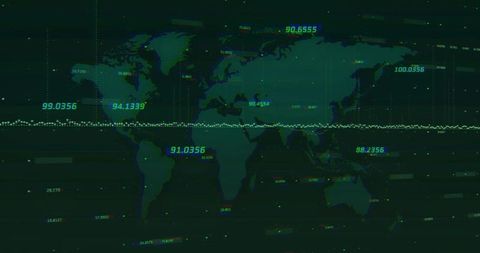
- Equirectangular Map Displaying Equatorial Telemetry Trace, Neon Grid and Glowing Labels
Equirectangular Map Displaying Equatorial Telemetry Trace, Neon Grid and Glowing Labels Image
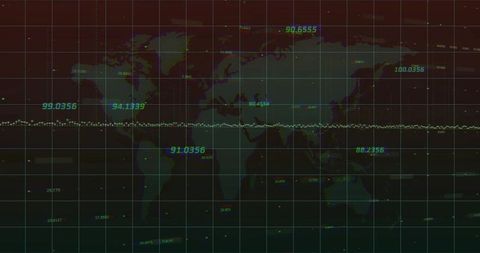
Dark equirectangular world map overlaid with gridlines and equatorial dotted telemetry trace, featuring glowing teal numeric labels and subtle glitch noise. Visual composition emphasizing horizontal equator line and evenly spaced data points, creating futuristic dashboard aesthetic. Working well for tech and science projects including dashboard backgrounds, website hero banners, presentation slides on global analytics, satellite telemetry demonstrations, cybersecurity visuals, and editorial features about geospatial intelligence. Color palette combining neon teal, cyan, deep green and muted red allowing for high-contrast overlays; graphic elements allowing placement of text, logos or UI widgets without losing readability.

downloads
Credit Photo
If you would like to credit the Photo, here are some ways you can do so
Free (free of charge)
Free for personal and commercial use.
Author: Creative Art