- Home >
- Stock Photos >
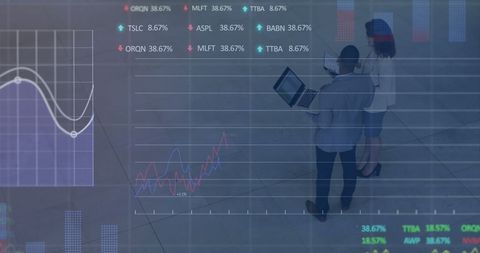
- Finance and Technology Theme with Stock Market Data Overlay
Finance and Technology Theme with Stock Market Data Overlay Image

Digital illustration showing overlapping elements of stock market charts and data integrated with a cityscape, illustrating connections between finance and technology. Useful for representing themes of investment and market analysis or educational purposes aimed at understanding financial systems.
Powered by 


2
downloads
downloads
Tags:
More
Credit Photo
If you would like to credit the Photo, here are some ways you can do so
Text Link
photo Link
<span class="text-link">
<span>
<a target="_blank" href=https://pikwizard.com/photo/finance-and-technology-theme-with-stock-market-data-overlay/db6eff822b88f74ba0ccf68f53787647/>PikWizard</a>
</span>
</span>
<span class="image-link">
<span
style="margin: 0 0 20px 0; display: inline-block; vertical-align: middle; width: 100%;"
>
<a
target="_blank"
href="https://pikwizard.com/photo/finance-and-technology-theme-with-stock-market-data-overlay/db6eff822b88f74ba0ccf68f53787647/"
style="text-decoration: none; font-size: 10px; margin: 0;"
>
<img src="https://pikwizard.com/pw/medium/db6eff822b88f74ba0ccf68f53787647.jpg" style="margin: 0; width: 100%;" alt="" />
<p style="font-size: 12px; margin: 0;">PikWizard</p>
</a>
</span>
</span>
Free (free of charge)
Free for personal and commercial use.
Author: Awesome Content
Similar Free Stock Images
Loading...

Premium


Premium


Premium


Premium


Premium

Premium


Premium


Premium


Premium


Premium


Premium


Premium


Premium


Premium


Premium


Premium


Premium


Premium


Premium


Premium


Premium

Premium


Premium


Premium


Premium