
- Home >
- Stock Photos >
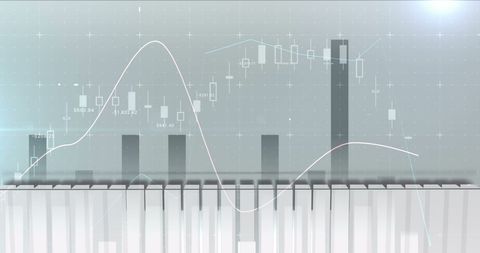
- Financial Chart and Data Analysis Background Technology Concept
Financial Chart and Data Analysis Background Technology Concept Image

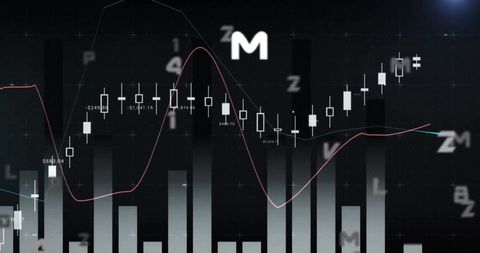
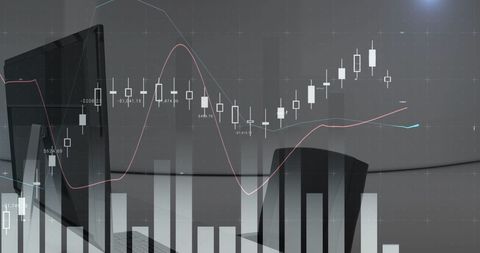
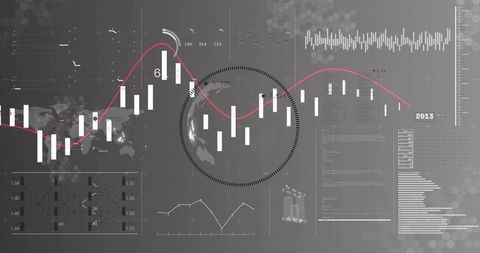
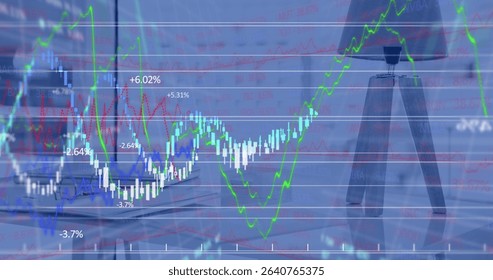
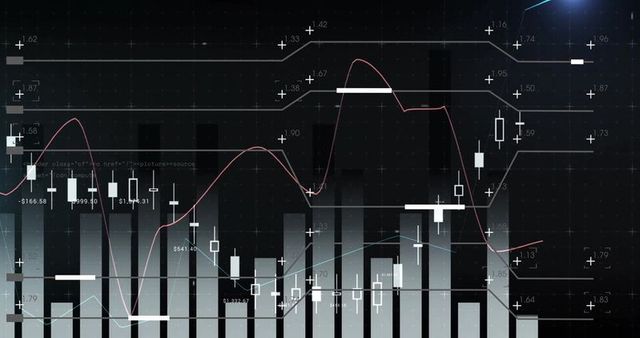
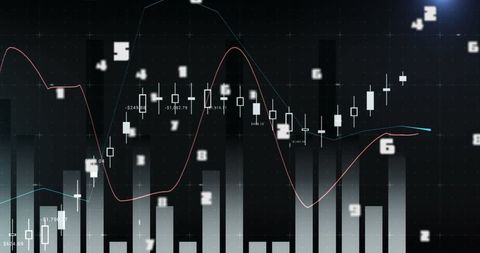
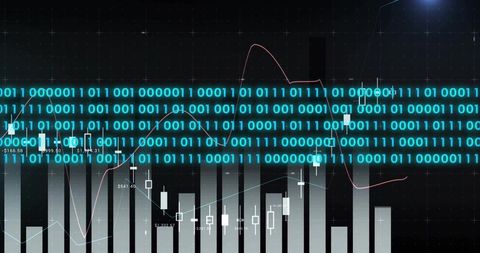
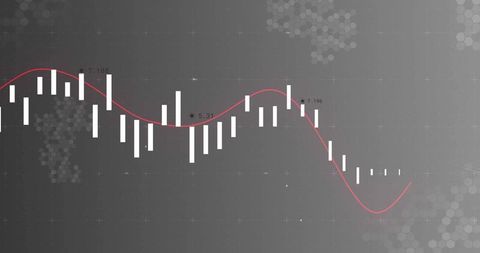
Graph and charts illustrate financial data analysis, symbolic of trends and movements in stocks. Useful for financial reports, business presentations, and articles on economic conditions or investment strategies.
Powered by  - Get 15% off with code: PIKWIZARD15


downloads
Tags:
More
Credit Photo
If you would like to credit the Photo, here are some ways you can do so
Text Link
photo Link
<span class="text-link">
<span>
<a target="_blank" href=https://pikwizard.com/photo/financial-chart-and-data-analysis-background-technology-concept/33f8090908d6e6a8e14f9533e1aa31b3/>PikWizard</a>
</span>
</span>
<span class="image-link">
<span
style="margin: 0 0 20px 0; display: inline-block; vertical-align: middle; width: 100%;"
>
<a
target="_blank"
href="https://pikwizard.com/photo/financial-chart-and-data-analysis-background-technology-concept/33f8090908d6e6a8e14f9533e1aa31b3/"
style="text-decoration: none; font-size: 10px; margin: 0;"
>
<img src="https://pikwizard.com/pw/medium/33f8090908d6e6a8e14f9533e1aa31b3.jpg" style="margin: 0; width: 100%;" alt="" />
<p style="font-size: 12px; margin: 0;">PikWizard</p>
</a>
</span>
</span>
Free (free of charge)
Free for personal and commercial use.
Author: Creative Art
Similar Free Stock Images

Premium


Premium


Premium


Premium


Premium

Premium


Premium

Premium


Premium


Premium


Premium


Premium

Premium

Premium


Premium


Premium


Premium


Premium

Premium


Premium

Premium


Premium


Premium

Premium


Premium


Explore More Free Stock Images