- Home >
- Stock Photos >
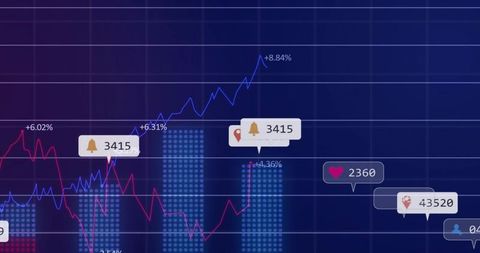
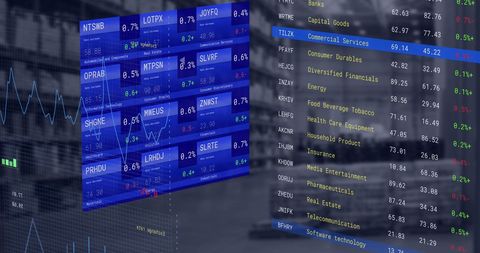
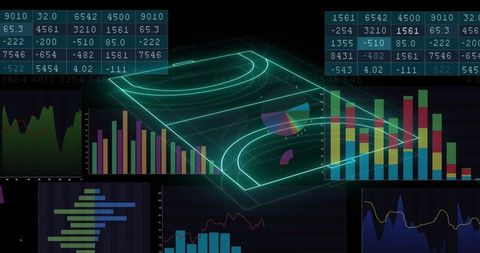
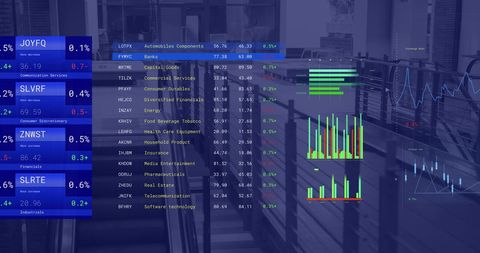
- Financial Data Analysis and Growth Indicators Display
Financial Data Analysis and Growth Indicators Display Image

This image depicts a virtual display showing financial data analytics and growth indicators with user interaction icons overlaying charts and graphs. Ideal for use in articles or promotional content related to finance, analytics, data science, technology advancement, and economic forecasting.

downloads
Tags:
More
Credit Photo
If you would like to credit the Photo, here are some ways you can do so
Text Link
photo Link
<span class="text-link">
<span>
<a target="_blank" href=https://pikwizard.com/photo/financial-data-analysis-and-growth-indicators-display/4a37d5e61450496122077e08dae080fc/>PikWizard</a>
</span>
</span>
<span class="image-link">
<span
style="margin: 0 0 20px 0; display: inline-block; vertical-align: middle; width: 100%;"
>
<a
target="_blank"
href="https://pikwizard.com/photo/financial-data-analysis-and-growth-indicators-display/4a37d5e61450496122077e08dae080fc/"
style="text-decoration: none; font-size: 10px; margin: 0;"
>
<img src="https://pikwizard.com/pw/medium/4a37d5e61450496122077e08dae080fc.jpg" style="margin: 0; width: 100%;" alt="" />
<p style="font-size: 12px; margin: 0;">PikWizard</p>
</a>
</span>
</span>
Free (free of charge)
Free for personal and commercial use.
Author: Authentic Images