
- Home >
- Stock Photos >
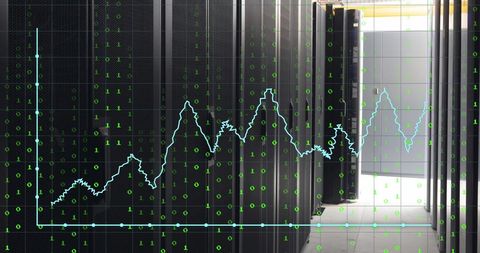
- Financial Data Analysis Displayed on Server Infrastructure
Financial Data Analysis Displayed on Server Infrastructure Image

Image depicts financial data overlay on servers, indicating integration of technology and economics. Useful for illustrating concepts in financial technology, data analytics, and the intersection of IT and global business markets.
Powered by 


downloads
Tags:
More
Credit Photo
If you would like to credit the Photo, here are some ways you can do so
Text Link
photo Link
<span class="text-link">
<span>
<a target="_blank" href=https://pikwizard.com/photo/financial-data-analysis-displayed-on-server-infrastructure/ae0f11d2eedc70ecc3408c252298e02e/>PikWizard</a>
</span>
</span>
<span class="image-link">
<span
style="margin: 0 0 20px 0; display: inline-block; vertical-align: middle; width: 100%;"
>
<a
target="_blank"
href="https://pikwizard.com/photo/financial-data-analysis-displayed-on-server-infrastructure/ae0f11d2eedc70ecc3408c252298e02e/"
style="text-decoration: none; font-size: 10px; margin: 0;"
>
<img src="https://pikwizard.com/pw/medium/ae0f11d2eedc70ecc3408c252298e02e.jpg" style="margin: 0; width: 100%;" alt="" />
<p style="font-size: 12px; margin: 0;">PikWizard</p>
</a>
</span>
</span>
Free (free of charge)
Free for personal and commercial use.
Author: Authentic Images
Similar Free Stock Images

Premium


Premium


Premium


Premium


Premium


Premium


Premium

Premium

Premium


Premium

Premium


Premium


Premium


Premium


Premium


Premium


Premium


Premium

Premium


Premium


Premium


Premium


Premium


Premium


Premium


Explore More Free Stock Images