
- Home >
- Stock Photos >
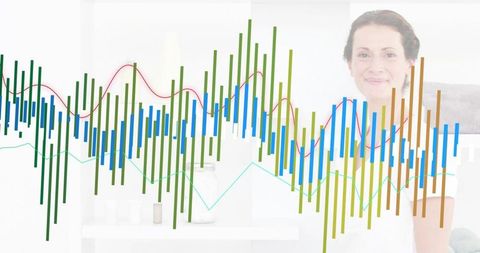
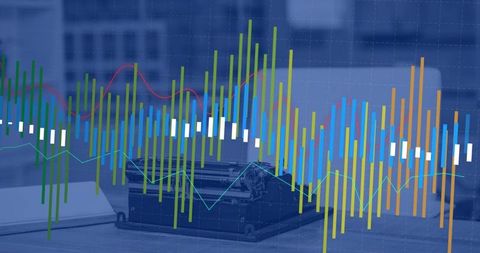
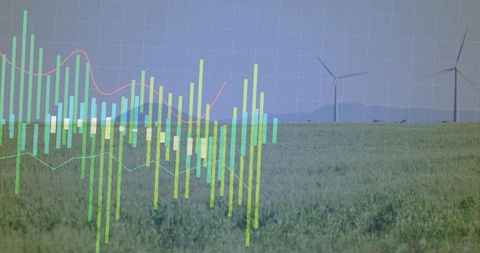
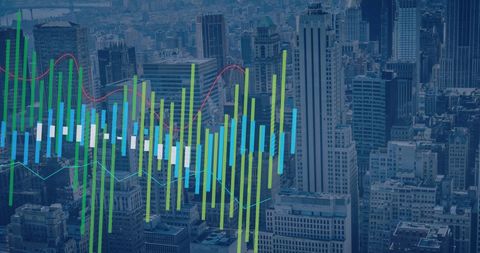
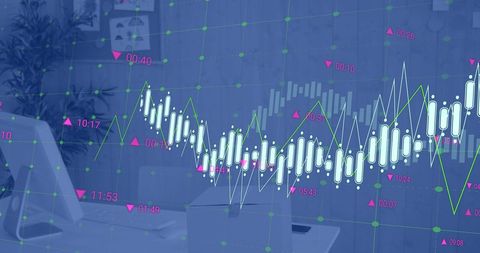
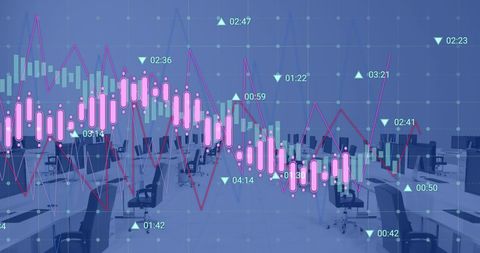
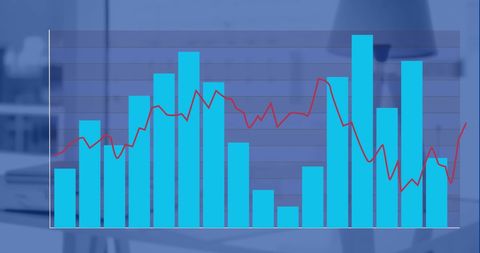
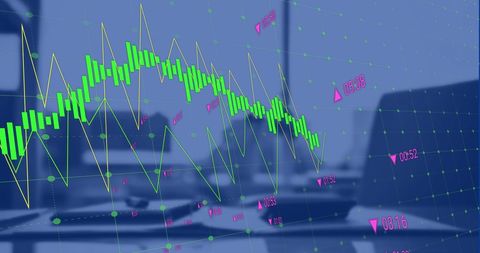
- Financial Data Analysis Visualization in Modern Office Environment
Financial Data Analysis Visualization in Modern Office Environment Image
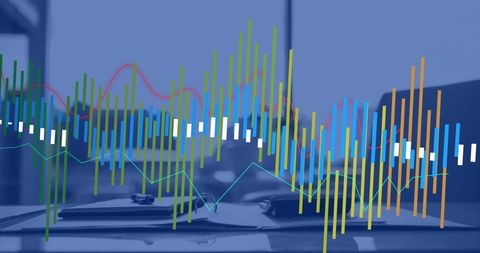
Colorful bar graphs and line charts overlay show financial data analysis in an office setup. Useful for illustrating concepts of global finance, modern business solutions, economic trends, and investment strategies in marketing materials, reports, or presentations.
Powered by 


downloads
Tags:
More
Credit Photo
If you would like to credit the Photo, here are some ways you can do so
Text Link
photo Link
<span class="text-link">
<span>
<a target="_blank" href=https://pikwizard.com/photo/financial-data-analysis-visualization-in-modern-office-environment/30b9567d6d29c31a5210b265d2a89d2c/>PikWizard</a>
</span>
</span>
<span class="image-link">
<span
style="margin: 0 0 20px 0; display: inline-block; vertical-align: middle; width: 100%;"
>
<a
target="_blank"
href="https://pikwizard.com/photo/financial-data-analysis-visualization-in-modern-office-environment/30b9567d6d29c31a5210b265d2a89d2c/"
style="text-decoration: none; font-size: 10px; margin: 0;"
>
<img src="https://pikwizard.com/pw/medium/30b9567d6d29c31a5210b265d2a89d2c.jpg" style="margin: 0; width: 100%;" alt="" />
<p style="font-size: 12px; margin: 0;">PikWizard</p>
</a>
</span>
</span>
Free (free of charge)
Free for personal and commercial use.
Author: Creative Art
Similar Free Stock Images

Premium


Premium


Premium


Premium


Premium

Premium


Premium


Premium

Premium


Premium

Premium


Premium

Premium

Premium


Premium


Premium


Premium

Premium


Premium


Premium


Premium


Premium


Premium


Premium

Premium

Explore More Free Stock Images