- Home >
- Stock Photos >
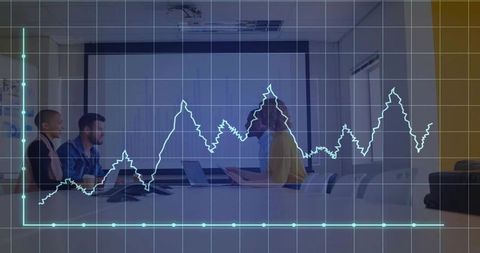
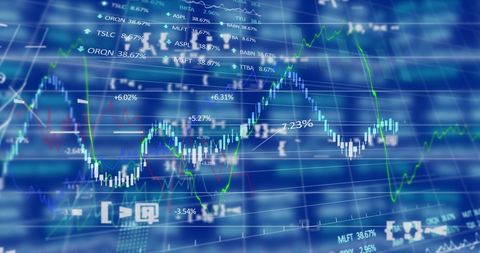
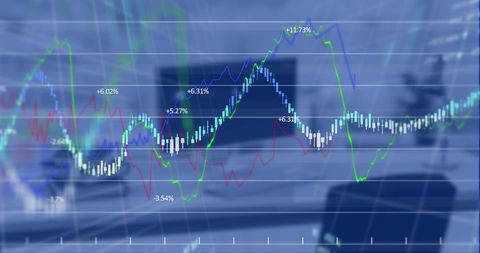
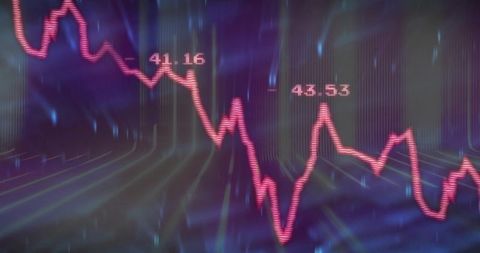
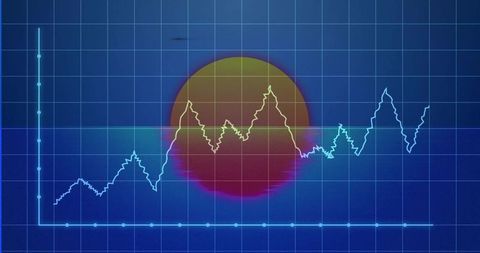
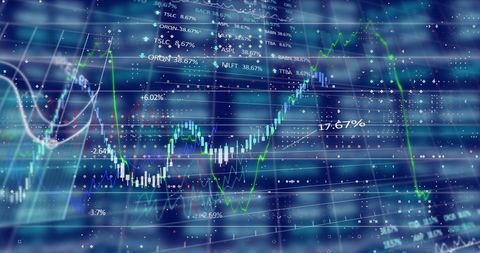
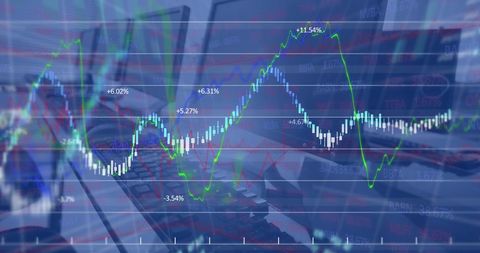
- Financial Data Analysis with Dynamic Charts and Graphs
Financial Data Analysis with Dynamic Charts and Graphs Image

This imagery of financial data processing features dynamic charts and graphs showing fluctuating financial indicators. Useful for illustrating financial reports, presentations on economic trends, stock market news, and investment analysis.

downloads
Tags:
More
Credit Photo
If you would like to credit the Photo, here are some ways you can do so
Text Link
photo Link
<span class="text-link">
<span>
<a target="_blank" href=https://pikwizard.com/photo/financial-data-analysis-with-dynamic-charts-and-graphs/d449b90e2b023a4609a58cd07a3f3568/>PikWizard</a>
</span>
</span>
<span class="image-link">
<span
style="margin: 0 0 20px 0; display: inline-block; vertical-align: middle; width: 100%;"
>
<a
target="_blank"
href="https://pikwizard.com/photo/financial-data-analysis-with-dynamic-charts-and-graphs/d449b90e2b023a4609a58cd07a3f3568/"
style="text-decoration: none; font-size: 10px; margin: 0;"
>
<img src="https://pikwizard.com/pw/medium/d449b90e2b023a4609a58cd07a3f3568.jpg" style="margin: 0; width: 100%;" alt="" />
<p style="font-size: 12px; margin: 0;">PikWizard</p>
</a>
</span>
</span>
Free (free of charge)
Free for personal and commercial use.
Author: Creative Art