- Home >
- Stock Photos >
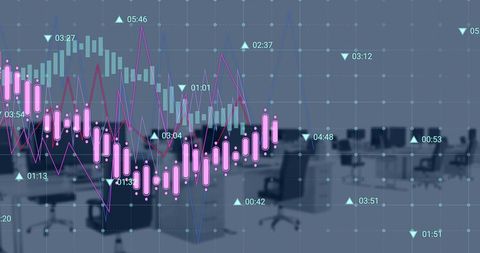
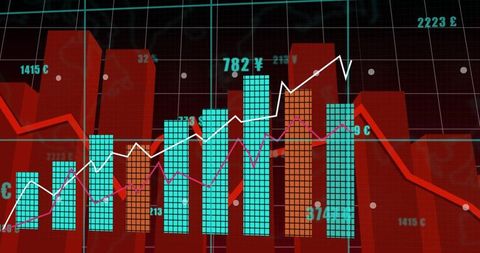
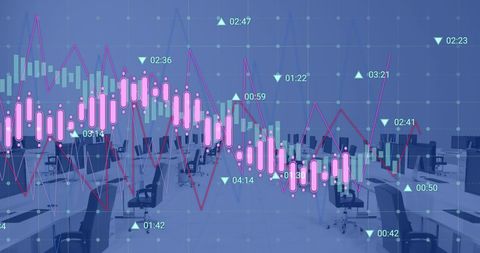
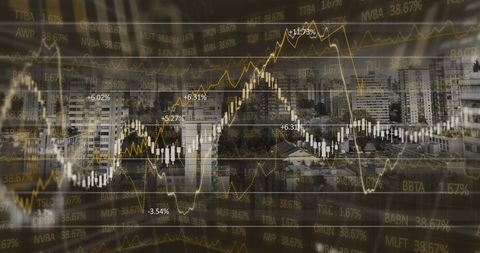
- Financial Data Analysis with Dynamic Graphs and Charts
Financial Data Analysis with Dynamic Graphs and Charts Image
Dynamic display of financial charts and graphs representing stock market and economic data trends. Charts feature fluctuating lines and percentages illustrating market changes, suitable for use in business, finance reports, economic studies, and presentations emphasizing data interpretation and analysis.

downloads
Tags:
More
Credit Photo
If you would like to credit the Photo, here are some ways you can do so
Text Link
photo Link
<span class="text-link">
<span>
<a target="_blank" href=https://pikwizard.com/photo/financial-data-analysis-with-dynamic-graphs-and-charts/343ee01ada0f640e2f53524eb479e45a/>PikWizard</a>
</span>
</span>
<span class="image-link">
<span
style="margin: 0 0 20px 0; display: inline-block; vertical-align: middle; width: 100%;"
>
<a
target="_blank"
href="https://pikwizard.com/photo/financial-data-analysis-with-dynamic-graphs-and-charts/343ee01ada0f640e2f53524eb479e45a/"
style="text-decoration: none; font-size: 10px; margin: 0;"
>
<img src="https://pikwizard.com/pw/medium/343ee01ada0f640e2f53524eb479e45a.jpg" style="margin: 0; width: 100%;" alt="" />
<p style="font-size: 12px; margin: 0;">PikWizard</p>
</a>
</span>
</span>
Free (free of charge)
Free for personal and commercial use.
Author: Awesome Content