
- Home >
- Stock Photos >
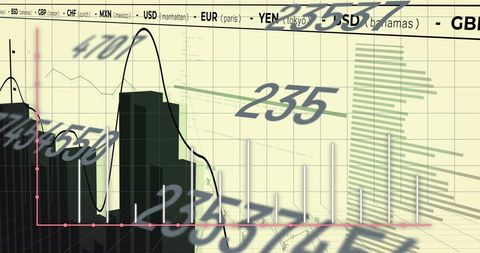
- Financial Data Analysis with Global Currencies Graphic Overlay
Financial Data Analysis with Global Currencies Graphic Overlay Image

Visual depiction of financial data processing combined with global currencies in focus. This can represent currency exchange rates, business growth trends, or economic analysis. Useful for illustrating financial articles, data analytics presentations, or global economic reports.
Powered by 


downloads
Tags:
More
Credit Photo
If you would like to credit the Photo, here are some ways you can do so
Text Link
photo Link
<span class="text-link">
<span>
<a target="_blank" href=https://pikwizard.com/photo/financial-data-analysis-with-global-currencies-graphic-overlay/9f251e904f05d0eb2ec23734864c9200/>PikWizard</a>
</span>
</span>
<span class="image-link">
<span
style="margin: 0 0 20px 0; display: inline-block; vertical-align: middle; width: 100%;"
>
<a
target="_blank"
href="https://pikwizard.com/photo/financial-data-analysis-with-global-currencies-graphic-overlay/9f251e904f05d0eb2ec23734864c9200/"
style="text-decoration: none; font-size: 10px; margin: 0;"
>
<img src="https://pikwizard.com/pw/medium/9f251e904f05d0eb2ec23734864c9200.jpg" style="margin: 0; width: 100%;" alt="" />
<p style="font-size: 12px; margin: 0;">PikWizard</p>
</a>
</span>
</span>
Free (free of charge)
Free for personal and commercial use.
Author: People Creations
Similar Free Stock Images
Loading...

Premium


Premium

Premium


Premium


Premium
Premium


Premium


Premium


Premium

Premium


Premium


Premium


Premium


Premium


Premium


Premium


Premium


Premium


Premium


Premium


Premium

Premium


Premium


Premium


Premium


Explore More Free Stock Images