
- Home >
- Stock Photos >
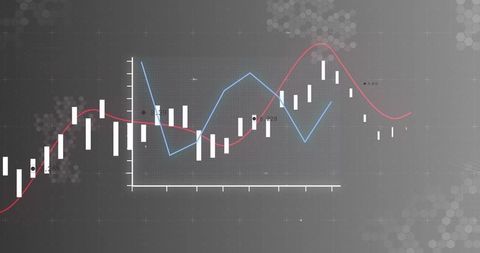
- Financial Data Analysis with Graphs on Grey Background
Financial Data Analysis with Graphs on Grey Background Image

Financial graph with indicators and bar charts visualized on stylish grey background suggests sophisticated analysis tools in business and finance sectors. Perfect for illustrating economic trends, educational resources on market analysis, or presentations discussing global finance methods.
Powered by 


downloads
Tags:
More
Credit Photo
If you would like to credit the Photo, here are some ways you can do so
Text Link
photo Link
<span class="text-link">
<span>
<a target="_blank" href=https://pikwizard.com/photo/financial-data-analysis-with-graphs-on-grey-background/f31e9307cdb9cdbfdbdc0e7ec3f9692c/>PikWizard</a>
</span>
</span>
<span class="image-link">
<span
style="margin: 0 0 20px 0; display: inline-block; vertical-align: middle; width: 100%;"
>
<a
target="_blank"
href="https://pikwizard.com/photo/financial-data-analysis-with-graphs-on-grey-background/f31e9307cdb9cdbfdbdc0e7ec3f9692c/"
style="text-decoration: none; font-size: 10px; margin: 0;"
>
<img src="https://pikwizard.com/pw/medium/f31e9307cdb9cdbfdbdc0e7ec3f9692c.jpg" style="margin: 0; width: 100%;" alt="" />
<p style="font-size: 12px; margin: 0;">PikWizard</p>
</a>
</span>
</span>
Free (free of charge)
Free for personal and commercial use.
Author: People Creations
Similar Free Stock Images

Premium


Premium

Premium


Premium


Premium


Premium


Premium


Premium

Premium

Premium

Premium


Premium


Premium


Premium


Premium


Premium


Premium


Premium


Premium


Premium


Premium


Premium


Premium


Premium


Premium


Explore More Free Stock Images