- Home >
- Stock Photos >
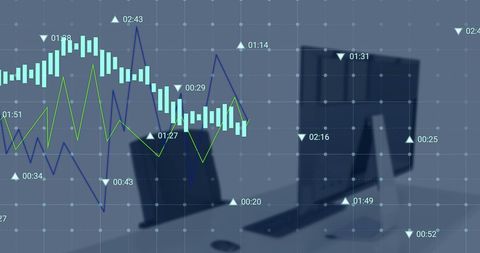
- Financial Data Analysis with Workspace Elements
Financial Data Analysis with Workspace Elements Image

A digital representation of financial analysis sketched over an organized workspace, including keyboard, glasses, and notebook. Dynamic lines and percentages highlight market fluctuations, creating an immersive view into trading or investment activities. Ideal for illustrating articles on financial markets, day trading, investment strategies, and economic analytics topics. Aesthetically blends traditional office elements with modern computational data.

downloads
Tags:
More
Credit Photo
If you would like to credit the Photo, here are some ways you can do so
Text Link
photo Link
<span class="text-link">
<span>
<a target="_blank" href=https://pikwizard.com/photo/financial-data-analysis-with-workspace-elements/ee54f437d0ce2a875caa8c0a3fa2c1f3/>PikWizard</a>
</span>
</span>
<span class="image-link">
<span
style="margin: 0 0 20px 0; display: inline-block; vertical-align: middle; width: 100%;"
>
<a
target="_blank"
href="https://pikwizard.com/photo/financial-data-analysis-with-workspace-elements/ee54f437d0ce2a875caa8c0a3fa2c1f3/"
style="text-decoration: none; font-size: 10px; margin: 0;"
>
<img src="https://pikwizard.com/pw/medium/ee54f437d0ce2a875caa8c0a3fa2c1f3.jpg" style="margin: 0; width: 100%;" alt="" />
<p style="font-size: 12px; margin: 0;">PikWizard</p>
</a>
</span>
</span>
Free (free of charge)
Free for personal and commercial use.
Author: People Creations