- Home >
- Stock Photos >
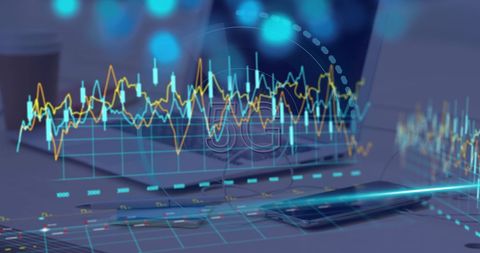
- Financial Data Analytics Display on Laptop with Graph Increments
Financial Data Analytics Display on Laptop with Graph Increments Image
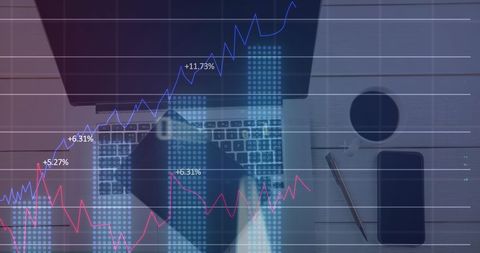
Laptop displaying financial data suggests concepts of monitoring investments and tracking market trends. China's geographical implications can show global marketplace concerns. Mention overlays emphasize business team strategy meetings focusing on financial growth. Useful for illustrating technological advancements in financial sectors or articles involving digital interfaces in analytical settings.

downloads
Tags:
More
Credit Photo
If you would like to credit the Photo, here are some ways you can do so
Text Link
photo Link
<span class="text-link">
<span>
<a target="_blank" href=https://pikwizard.com/photo/financial-data-analytics-display-on-laptop-with-graph-increments/a42889cff463cc7acbab50cb3217cf80/>PikWizard</a>
</span>
</span>
<span class="image-link">
<span
style="margin: 0 0 20px 0; display: inline-block; vertical-align: middle; width: 100%;"
>
<a
target="_blank"
href="https://pikwizard.com/photo/financial-data-analytics-display-on-laptop-with-graph-increments/a42889cff463cc7acbab50cb3217cf80/"
style="text-decoration: none; font-size: 10px; margin: 0;"
>
<img src="https://pikwizard.com/pw/medium/a42889cff463cc7acbab50cb3217cf80.jpg" style="margin: 0; width: 100%;" alt="" />
<p style="font-size: 12px; margin: 0;">PikWizard</p>
</a>
</span>
</span>
Free (free of charge)
Free for personal and commercial use.
Author: People Creations