
- Home >
- Stock Photos >
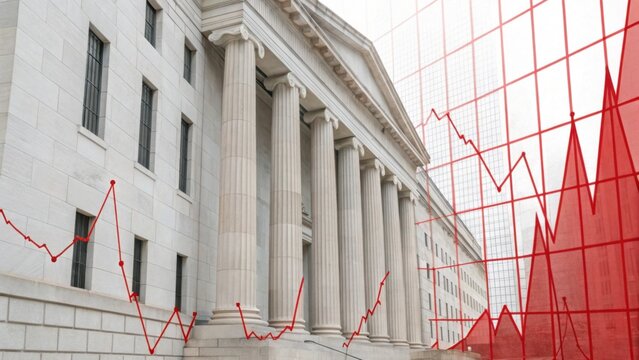
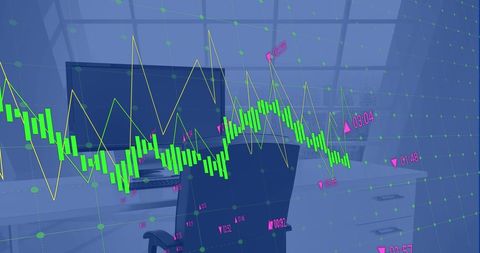
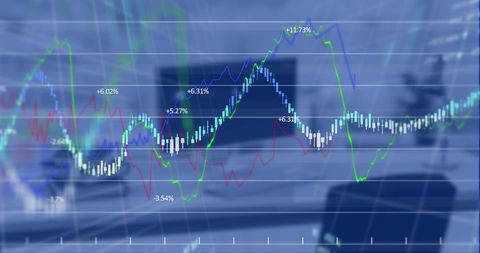
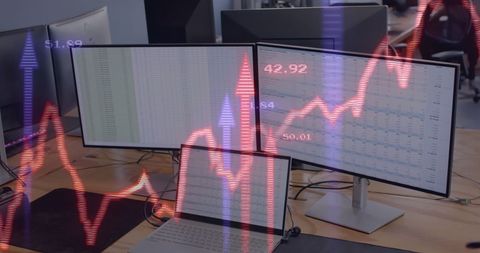
- Financial Data Analytics on Computer Screen with Red Graph Line
Financial Data Analytics on Computer Screen with Red Graph Line Image

Digital concept showcasing financial data analytics on computer screen with striking red graph line. Ideal for articles on finance technology, business growth, or investment strategy trends. Useful for economic reports, business blog posts, or fintech presentations depicting digital financial monitoring and assessment.
Powered by 


downloads
Tags:
More
Credit Photo
If you would like to credit the Photo, here are some ways you can do so
Text Link
photo Link
<span class="text-link">
<span>
<a target="_blank" href=https://pikwizard.com/photo/financial-data-analytics-on-computer-screen-with-red-graph-line/9932d877cd3b8fb0451ee8bfc2c4889f/>PikWizard</a>
</span>
</span>
<span class="image-link">
<span
style="margin: 0 0 20px 0; display: inline-block; vertical-align: middle; width: 100%;"
>
<a
target="_blank"
href="https://pikwizard.com/photo/financial-data-analytics-on-computer-screen-with-red-graph-line/9932d877cd3b8fb0451ee8bfc2c4889f/"
style="text-decoration: none; font-size: 10px; margin: 0;"
>
<img src="https://pikwizard.com/pw/medium/9932d877cd3b8fb0451ee8bfc2c4889f.jpg" style="margin: 0; width: 100%;" alt="" />
<p style="font-size: 12px; margin: 0;">PikWizard</p>
</a>
</span>
</span>
Free (free of charge)
Free for personal and commercial use.
Author: Authentic Images
Similar Free Stock Images

Premium

Premium

Premium


Premium


Premium


Premium
Premium


Premium


Premium


AI


AI


Premium

AI

Premium


Premium


Premium


Premium


AI


Premium


Premium


Premium


Premium


Premium

Premium


Premium


Premium

Premium


Premium

Premium


Explore More Free Stock Images