
- Home >
- Stock Photos >
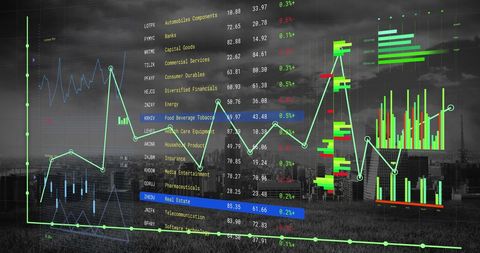
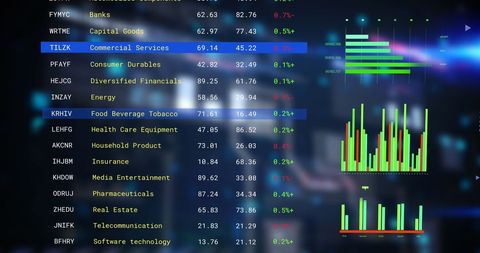
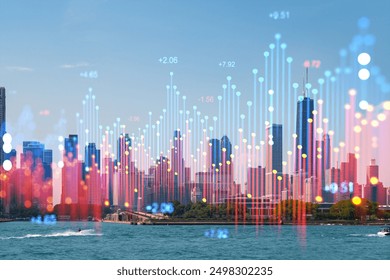
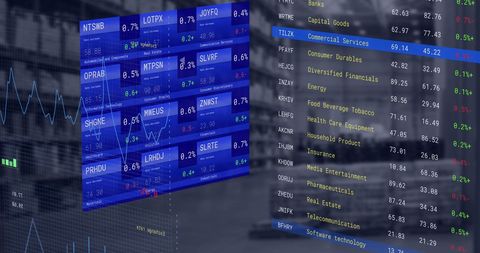
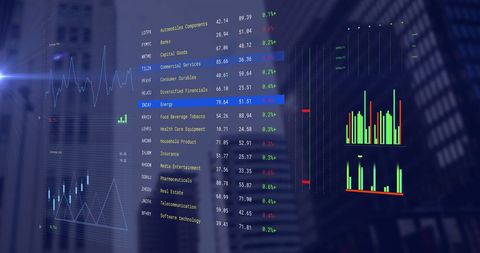
- Financial Data Analytics with Cityscape Backdrop
Financial Data Analytics with Cityscape Backdrop Image

Financial data displayed over a city background unites themes of global networks, business, and advanced analytics. Graphs and percentages hint at trading and stock market movements, attracting those within finance and economic sectors. Perfectly suited for content on financial trends, investment strategy analysis, fintech advancements, or city organization networks.
Powered by  - Get 15% off with code: PIKWIZARD15


downloads
Tags:
More
Credit Photo
If you would like to credit the Photo, here are some ways you can do so
Text Link
photo Link
<span class="text-link">
<span>
<a target="_blank" href=https://pikwizard.com/photo/financial-data-analytics-with-cityscape-backdrop/4412b2cec7286ceb8d109545bc18860f/>PikWizard</a>
</span>
</span>
<span class="image-link">
<span
style="margin: 0 0 20px 0; display: inline-block; vertical-align: middle; width: 100%;"
>
<a
target="_blank"
href="https://pikwizard.com/photo/financial-data-analytics-with-cityscape-backdrop/4412b2cec7286ceb8d109545bc18860f/"
style="text-decoration: none; font-size: 10px; margin: 0;"
>
<img src="https://pikwizard.com/pw/medium/4412b2cec7286ceb8d109545bc18860f.jpg" style="margin: 0; width: 100%;" alt="" />
<p style="font-size: 12px; margin: 0;">PikWizard</p>
</a>
</span>
</span>
Free (free of charge)
Free for personal and commercial use.
Author: Authentic Images
Similar Free Stock Images

Premium


Premium

Premium


Premium

Premium

Premium


Premium


Premium

Premium


Premium

Premium

Premium

Premium


Premium


Premium


Premium


Premium


Premium


Premium


Premium


Premium


Premium


Premium

Premium

Premium


Explore More Free Stock Images