
- Home >
- Stock Photos >
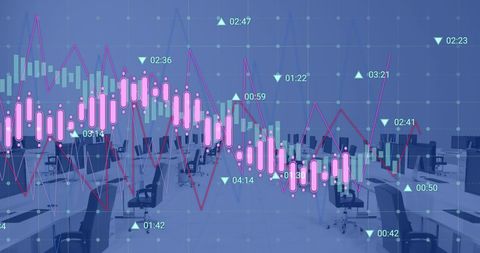
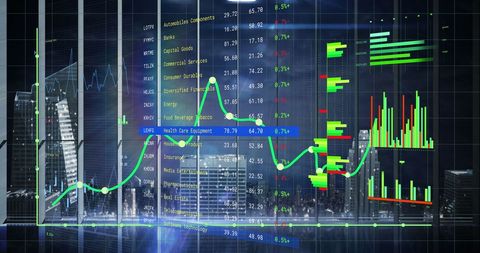
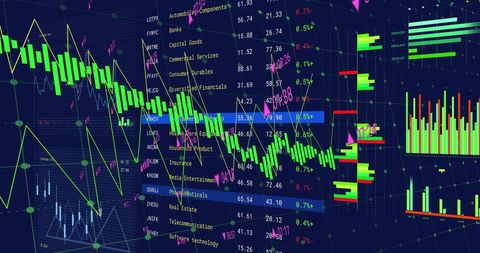
- Financial Data Charts on Digital Interface Background
Financial Data Charts on Digital Interface Background Image

Visual depicting financial data charts on a digital interface, highlighting the interconnectedness and complexity of global business. The setting suggests modern technologies and digital finance strategies. Ideal for use by financial analysts, tech companies, stock traders, or in presentations about economic trends.
Powered by 


downloads
Tags:
More
Credit Photo
If you would like to credit the Photo, here are some ways you can do so
Text Link
photo Link
<span class="text-link">
<span>
<a target="_blank" href=https://pikwizard.com/photo/financial-data-charts-on-digital-interface-background/f3411ca786f9c9bf07fd78c0405fd4d1/>PikWizard</a>
</span>
</span>
<span class="image-link">
<span
style="margin: 0 0 20px 0; display: inline-block; vertical-align: middle; width: 100%;"
>
<a
target="_blank"
href="https://pikwizard.com/photo/financial-data-charts-on-digital-interface-background/f3411ca786f9c9bf07fd78c0405fd4d1/"
style="text-decoration: none; font-size: 10px; margin: 0;"
>
<img src="https://pikwizard.com/pw/medium/f3411ca786f9c9bf07fd78c0405fd4d1.jpg" style="margin: 0; width: 100%;" alt="" />
<p style="font-size: 12px; margin: 0;">PikWizard</p>
</a>
</span>
</span>
Free (free of charge)
Free for personal and commercial use.
Author: Awesome Content
Similar Free Stock Images

Premium


Premium

Premium

Premium


Premium

Premium


Premium


Premium

Premium


AI


Premium


Premium


Premium

Premium

Premium


Premium

Premium


Premium


Premium


Premium

Premium


AI


Premium


Premium

Premium


Premium

Premium


Explore More Free Stock Images