- Home >
- Stock Photos >
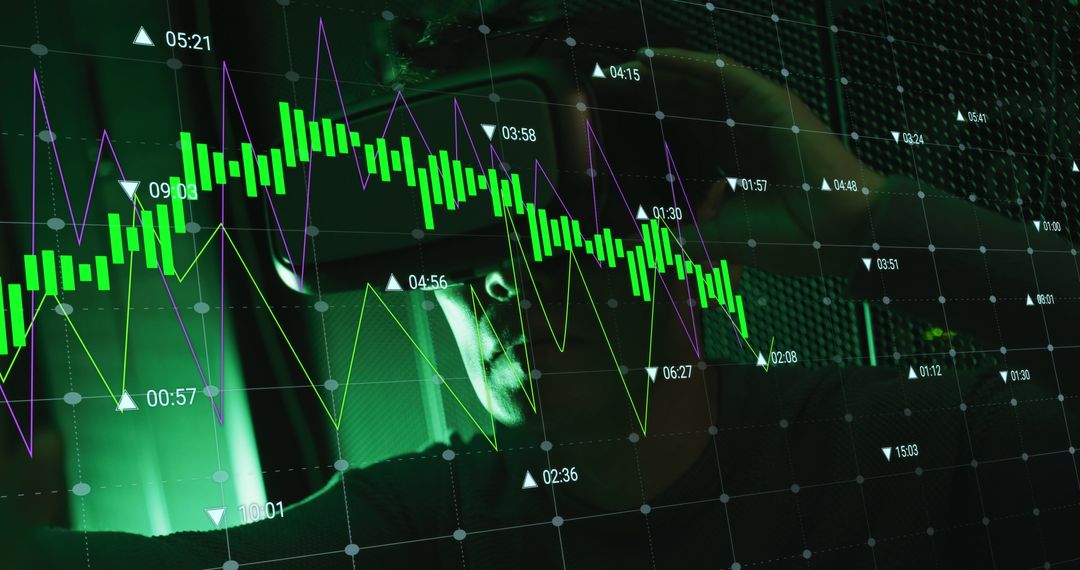
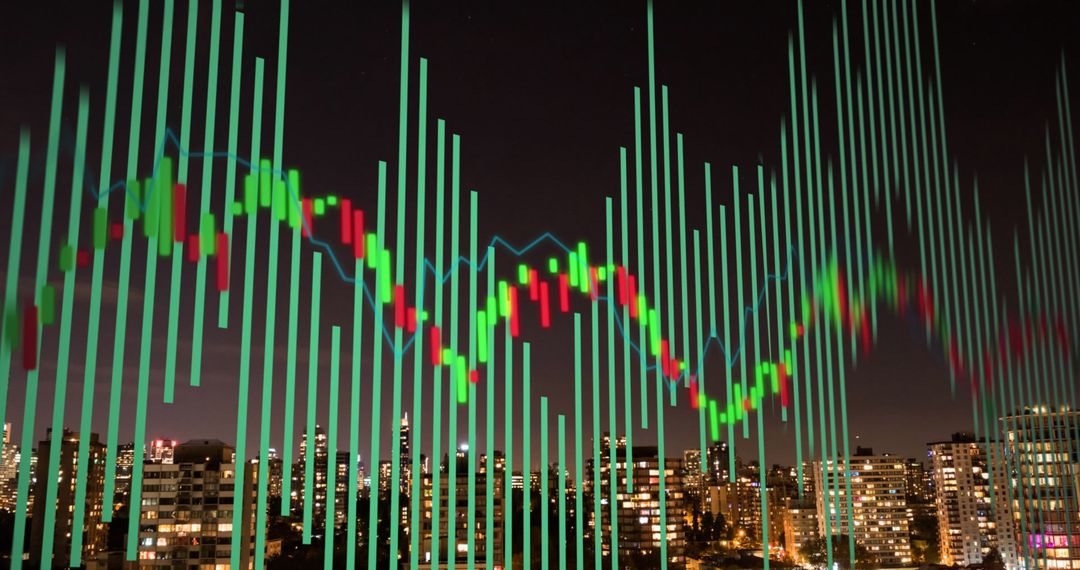
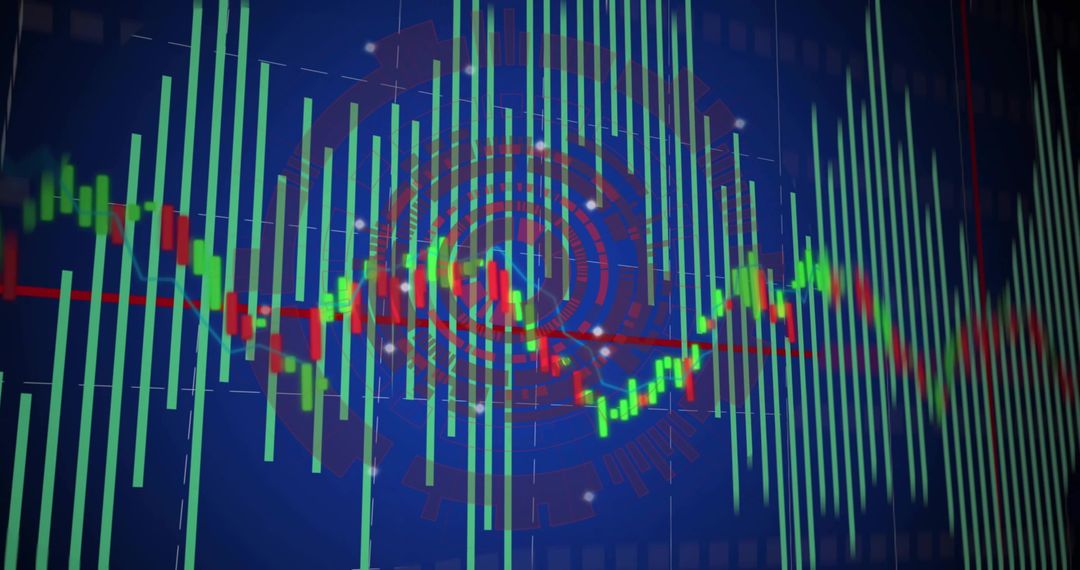
- Financial Data Display with Candlesticks and Trend Lines on Digital Dashboard
Financial Data Display with Candlesticks and Trend Lines on Digital Dashboard Image

Financial chart display featuring candlestick patterns and trend lines visualized on trading dashboard. Suitable for illustrating dynamics in stock market trading, investment trends, economic analysis, financial reports, and presentations on market analytics and cybersecurity in digital finance sectors.
Powered by  - Get 15% off with code: PIKWIZARD15


2
downloads
downloads
Tags:
More
Credit Photo
If you would like to credit the Photo, here are some ways you can do so
Text Link
photo Link
<span class="text-link">
<span>
<a target="_blank" href=https://pikwizard.com/photo/financial-data-display-with-candlesticks-and-trend-lines-on-digital-dashboard/c691287660672313760e01a71629d563/>PikWizard</a>
</span>
</span>
<span class="image-link">
<span
style="margin: 0 0 20px 0; display: inline-block; vertical-align: middle; width: 100%;"
>
<a
target="_blank"
href="https://pikwizard.com/photo/financial-data-display-with-candlesticks-and-trend-lines-on-digital-dashboard/c691287660672313760e01a71629d563/"
style="text-decoration: none; font-size: 10px; margin: 0;"
>
<img src="https://pikwizard.com/pw/medium/c691287660672313760e01a71629d563.jpg" style="margin: 0; width: 100%;" alt="" />
<p style="font-size: 12px; margin: 0;">PikWizard</p>
</a>
</span>
</span>
Free (free of charge)
Free for personal and commercial use.
Author: People Creations