- Home >
- Stock Photos >
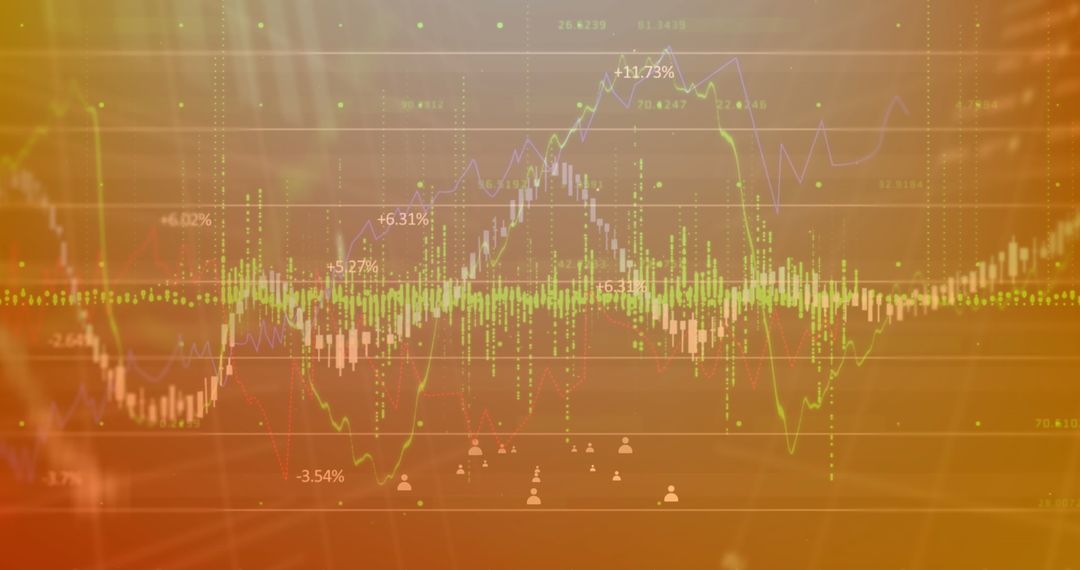
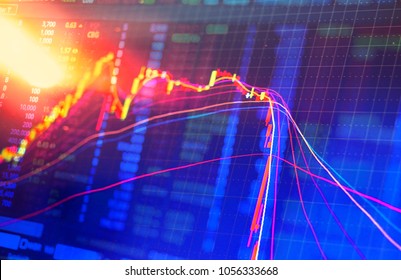
- Financial Data Display with Fiery Match Symbolizing Market Volatility
Financial Data Display with Fiery Match Symbolizing Market Volatility Image

Foreground features a lit match blending with financial data, conveying market volatility and dynamic changes. Suitable for illustrations on market risks, economic analysis, or investment themes, highlighting both analytics and unpredictable market nature.
Powered by  - Get 15% off with code: PIKWIZARD15


2
downloads
downloads
Tags:
More
Credit Photo
If you would like to credit the Photo, here are some ways you can do so
Text Link
photo Link
<span class="text-link">
<span>
<a target="_blank" href=https://pikwizard.com/photo/financial-data-display-with-fiery-match-symbolizing-market-volatility/47c8b8c67b5a643fb6ae8b93e9d025f4/>PikWizard</a>
</span>
</span>
<span class="image-link">
<span
style="margin: 0 0 20px 0; display: inline-block; vertical-align: middle; width: 100%;"
>
<a
target="_blank"
href="https://pikwizard.com/photo/financial-data-display-with-fiery-match-symbolizing-market-volatility/47c8b8c67b5a643fb6ae8b93e9d025f4/"
style="text-decoration: none; font-size: 10px; margin: 0;"
>
<img src="https://pikwizard.com/pw/medium/47c8b8c67b5a643fb6ae8b93e9d025f4.jpg" style="margin: 0; width: 100%;" alt="" />
<p style="font-size: 12px; margin: 0;">PikWizard</p>
</a>
</span>
</span>
Free (free of charge)
Free for personal and commercial use.
Author: Awesome Content
Similar Free Stock Images

Premium


Premium


Premium


Premium


Premium


Premium


Premium


Premium


Premium


Premium


Premium


Premium


Premium


Premium


Premium


Premium


Premium


Premium


Premium


Premium


Premium


Premium


Premium


Premium