- Home >
- Stock Photos >
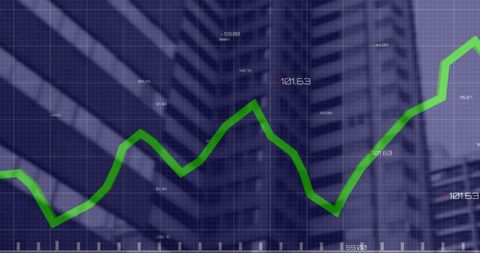
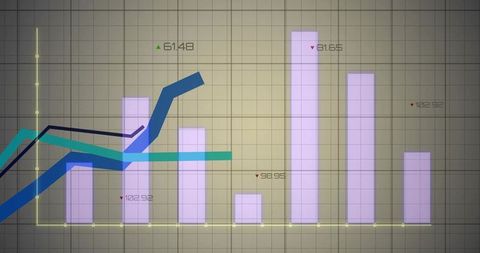
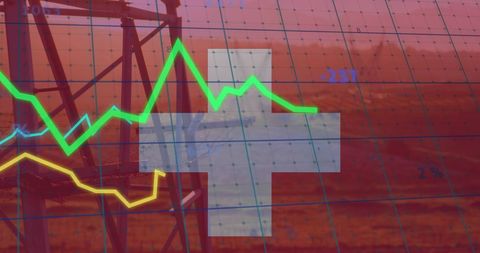
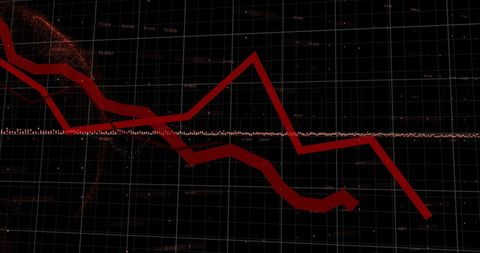
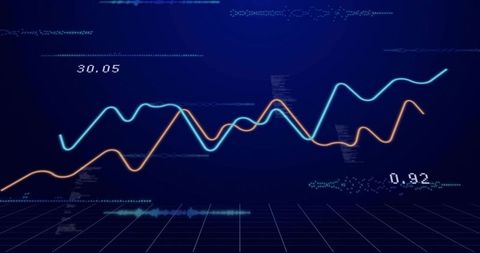
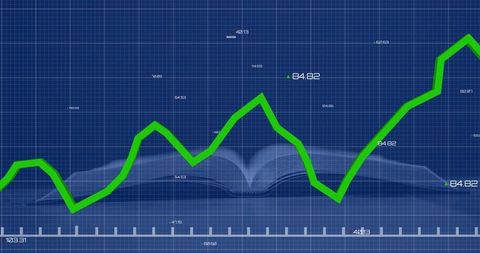
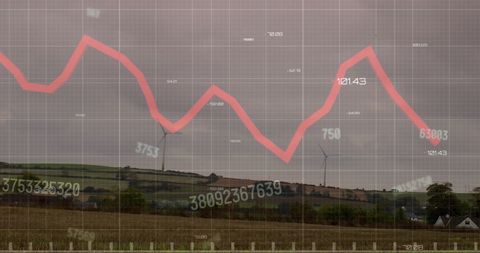
- Financial Data Graphics Overlaying Abstract Flames Background
Financial Data Graphics Overlaying Abstract Flames Background Image

Graphs showing financial trends intermixed with fiery visual elements, creating a dramatic effect highlighting financial volatility or intense market activity. Suitable for websites, presentations, or projects focused on business analysis, market research, economic forecasts, and global finance insights.

downloads
Tags:
More
Credit Photo
If you would like to credit the Photo, here are some ways you can do so
Text Link
photo Link
<span class="text-link">
<span>
<a target="_blank" href=https://pikwizard.com/photo/financial-data-graphics-overlaying-abstract-flames-background/f577057036403e4beb5f9aa0d2d8bef0/>PikWizard</a>
</span>
</span>
<span class="image-link">
<span
style="margin: 0 0 20px 0; display: inline-block; vertical-align: middle; width: 100%;"
>
<a
target="_blank"
href="https://pikwizard.com/photo/financial-data-graphics-overlaying-abstract-flames-background/f577057036403e4beb5f9aa0d2d8bef0/"
style="text-decoration: none; font-size: 10px; margin: 0;"
>
<img src="https://pikwizard.com/pw/medium/f577057036403e4beb5f9aa0d2d8bef0.jpg" style="margin: 0; width: 100%;" alt="" />
<p style="font-size: 12px; margin: 0;">PikWizard</p>
</a>
</span>
</span>
Free (free of charge)
Free for personal and commercial use.
Author: Creative Art