
- Home >
- Stock Photos >
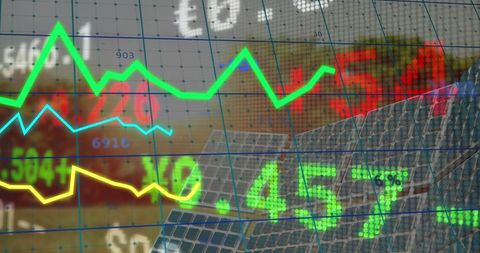
- Financial Data Graphs and Technology Interface Background
Financial Data Graphs and Technology Interface Background Image

Dynamic presentation of financial data overlaying grid background symbolizes advanced economic analysis and technology. Useful for illustrating stock market trends, business technologies, quantitative financial methods, or as a backdrop for finance-related presentations and reports.
Powered by 


downloads
Tags:
More
Credit Photo
If you would like to credit the Photo, here are some ways you can do so
Text Link
photo Link
<span class="text-link">
<span>
<a target="_blank" href=https://pikwizard.com/photo/financial-data-graphs-and-technology-interface-background/4b98854e5dce0e41beb1a19067d64410/>PikWizard</a>
</span>
</span>
<span class="image-link">
<span
style="margin: 0 0 20px 0; display: inline-block; vertical-align: middle; width: 100%;"
>
<a
target="_blank"
href="https://pikwizard.com/photo/financial-data-graphs-and-technology-interface-background/4b98854e5dce0e41beb1a19067d64410/"
style="text-decoration: none; font-size: 10px; margin: 0;"
>
<img src="https://pikwizard.com/pw/medium/4b98854e5dce0e41beb1a19067d64410.jpg" style="margin: 0; width: 100%;" alt="" />
<p style="font-size: 12px; margin: 0;">PikWizard</p>
</a>
</span>
</span>
Free (free of charge)
Free for personal and commercial use.
Author: Authentic Images
Similar Free Stock Images

Premium


Premium

Premium


Premium


Premium


Premium


Premium


Premium

Premium


Premium


Premium

Premium


Premium


Premium


Premium


Premium


Premium

Premium


Premium


Premium


Premium


Premium


Premium

Premium


Premium


Explore More Free Stock Images