- Home >
- Stock Photos >
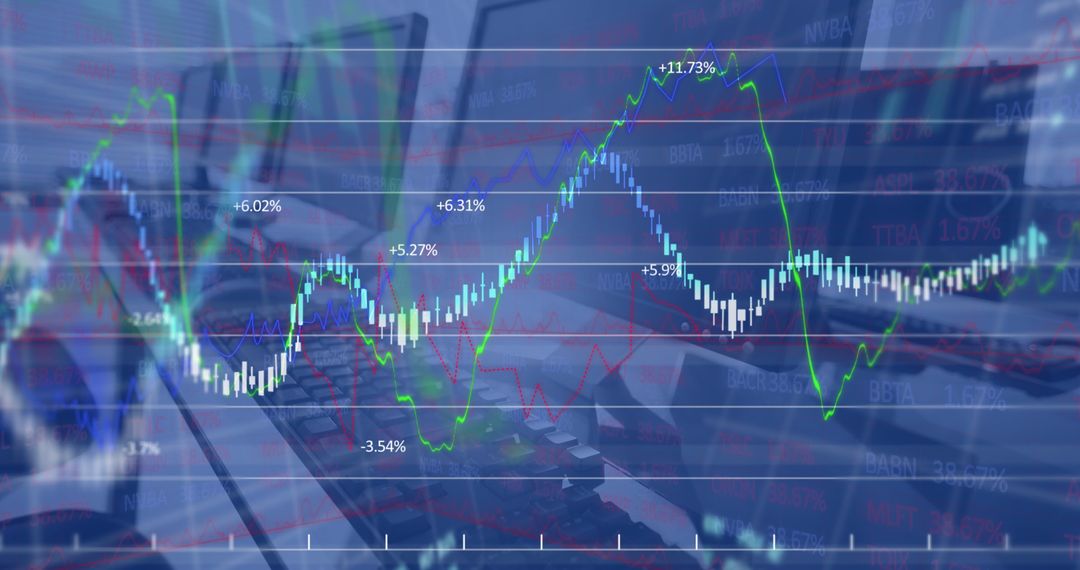
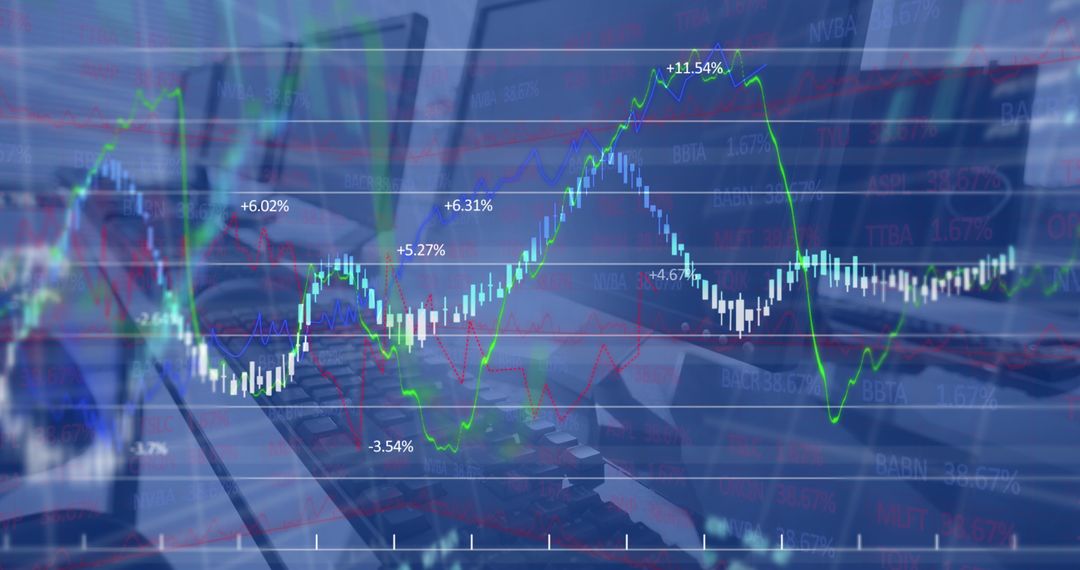
- Financial Data Overlay with Flame Background Symbolizing Risk
Financial Data Overlay with Flame Background Symbolizing Risk Image

Conceptual illustration combining financial data processing elements with a background of flames, representing volatility and risk in the financial markets. This imagery is ideal for use in presentations, articles focusing on economic instability, investment risk, or financial market education. It captures the abstract thought of assessing and managing market challenges.
Powered by  - Get 15% off with code: PIKWIZARD15


2
downloads
downloads
Tags:
More
Credit Photo
If you would like to credit the Photo, here are some ways you can do so
Text Link
photo Link
<span class="text-link">
<span>
<a target="_blank" href=https://pikwizard.com/photo/financial-data-overlay-with-flame-background-symbolizing-risk/d320ea3330e5a72f3b7f87221340290d/>PikWizard</a>
</span>
</span>
<span class="image-link">
<span
style="margin: 0 0 20px 0; display: inline-block; vertical-align: middle; width: 100%;"
>
<a
target="_blank"
href="https://pikwizard.com/photo/financial-data-overlay-with-flame-background-symbolizing-risk/d320ea3330e5a72f3b7f87221340290d/"
style="text-decoration: none; font-size: 10px; margin: 0;"
>
<img src="https://pikwizard.com/pw/medium/d320ea3330e5a72f3b7f87221340290d.jpg" style="margin: 0; width: 100%;" alt="" />
<p style="font-size: 12px; margin: 0;">PikWizard</p>
</a>
</span>
</span>
Free (free of charge)
Free for personal and commercial use.
Author: Creative Art
Similar Free Stock Images

Premium


Premium


Premium


Premium


Premium


Premium


Premium


Premium


Premium


Premium


Premium


Premium


Premium


Premium


Premium


Premium


Premium


Premium


Premium


Premium


Premium


Premium


Premium


Premium