- Home >
- Stock Photos >
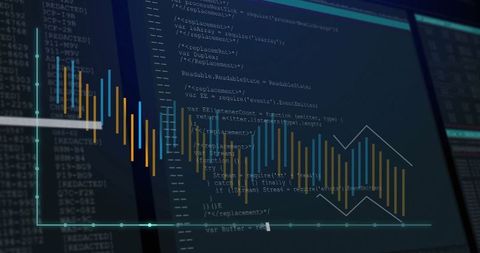
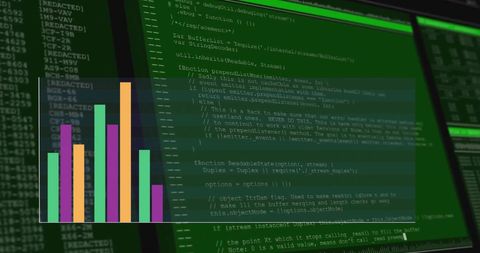
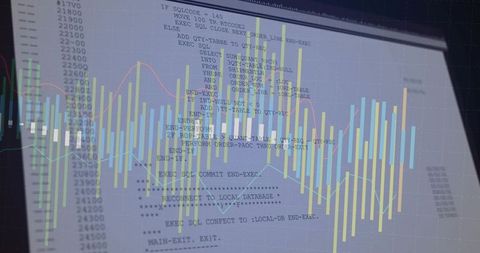
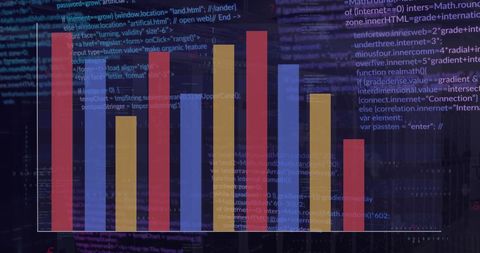
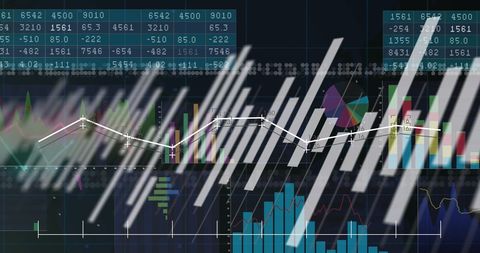
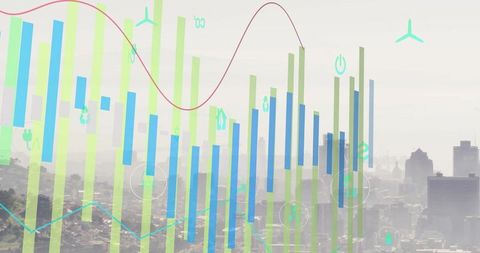
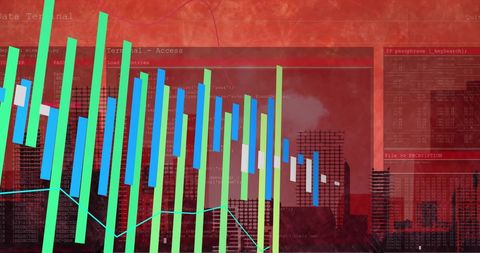
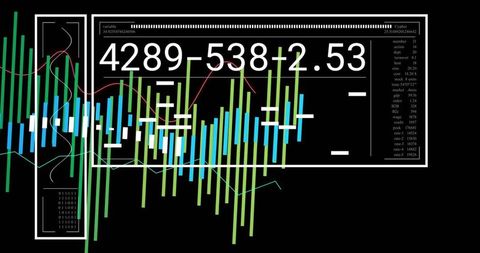
- Financial Data Processing with Code Overlays and Graphs
Financial Data Processing with Code Overlays and Graphs Image

This image shows financial data visualization with colorful graphs and computer code in the background. It illustrates the intersection of coding and finance, necessary in digital business environments. Useful for presentations, articles, or websites about fintech, data analysis, and financial technologies.

downloads
Tags:
More
Credit Photo
If you would like to credit the Photo, here are some ways you can do so
Text Link
photo Link
<span class="text-link">
<span>
<a target="_blank" href=https://pikwizard.com/photo/financial-data-processing-with-code-overlays-and-graphs/95f8ac02636bc7337151eb93e7dfd1bc/>PikWizard</a>
</span>
</span>
<span class="image-link">
<span
style="margin: 0 0 20px 0; display: inline-block; vertical-align: middle; width: 100%;"
>
<a
target="_blank"
href="https://pikwizard.com/photo/financial-data-processing-with-code-overlays-and-graphs/95f8ac02636bc7337151eb93e7dfd1bc/"
style="text-decoration: none; font-size: 10px; margin: 0;"
>
<img src="https://pikwizard.com/pw/medium/95f8ac02636bc7337151eb93e7dfd1bc.jpg" style="margin: 0; width: 100%;" alt="" />
<p style="font-size: 12px; margin: 0;">PikWizard</p>
</a>
</span>
</span>
Free (free of charge)
Free for personal and commercial use.
Author: Creative Art