- Home >
- Stock Photos >
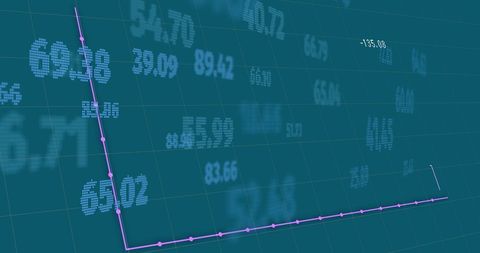
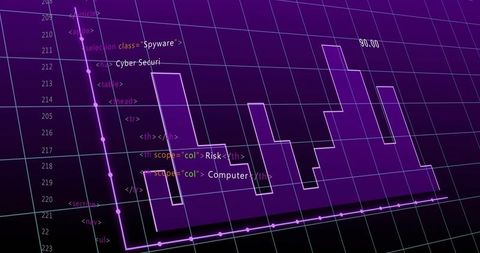
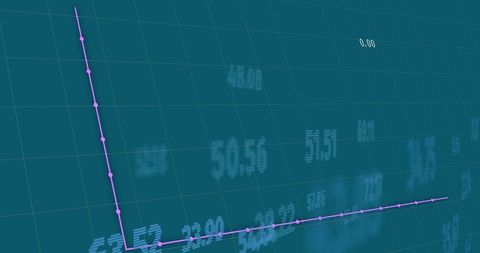
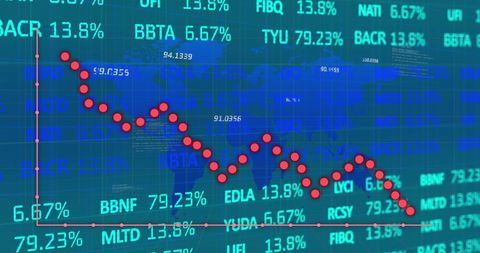
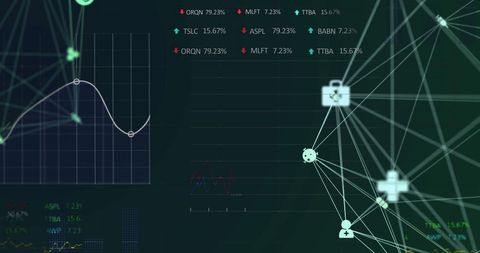
- Financial Data Processing with Digital Analysis Graphs
Financial Data Processing with Digital Analysis Graphs Image
Illustration showcasing digital graphs and charts associated with financial data processing on a blue background. This concept aligns with themes in global business, stock market analysis, and technological aspects of finance. Useful for articles, presentations, or websites dedicated to financial studies, economic trends, or business technology.

downloads
Tags:
More
Credit Photo
If you would like to credit the Photo, here are some ways you can do so
Text Link
photo Link
<span class="text-link">
<span>
<a target="_blank" href=https://pikwizard.com/photo/financial-data-processing-with-digital-analysis-graphs/49ea9bd6530975cf2fb95ba1a5963994/>PikWizard</a>
</span>
</span>
<span class="image-link">
<span
style="margin: 0 0 20px 0; display: inline-block; vertical-align: middle; width: 100%;"
>
<a
target="_blank"
href="https://pikwizard.com/photo/financial-data-processing-with-digital-analysis-graphs/49ea9bd6530975cf2fb95ba1a5963994/"
style="text-decoration: none; font-size: 10px; margin: 0;"
>
<img src="https://pikwizard.com/pw/medium/49ea9bd6530975cf2fb95ba1a5963994.jpg" style="margin: 0; width: 100%;" alt="" />
<p style="font-size: 12px; margin: 0;">PikWizard</p>
</a>
</span>
</span>
Free (free of charge)
Free for personal and commercial use.
Author: Creative Art