
- Home >
- Free Stock Photos & Images >
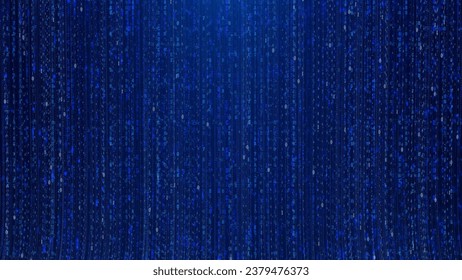
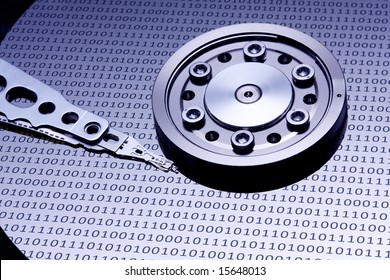
- Neon binary data streaming across tilted HUD grid with red triangular pointer and cyan highlights
Neon binary data streaming across tilted HUD grid with red triangular pointer and cyan highlights Free Stock Image

Featuring neon cyan and green binary columns streaming over tilted HUD grid with red triangular pointer and scattered blue squares. Evoking futuristic cyber interface and high-tech data flow, making concept suitable for cybersecurity, AI, machine learning, fintech, and software development themes. Working well for hero headers, website banners, presentation slides, marketing campaigns, app UI mockups, and video overlays. Allowing designers to layer text, icons, or graphs while preserving strong sense of motion and depth. Providing bold neon palette and technical atmosphere for branding, editorial layouts, tech reports, pitch decks, and social media visuals.
Powered by  - Get 15% off with code: PIKWIZARD15


downloads
Tags:
More
Credit Photo
If you would like to credit the Photo, here are some ways you can do so
Text Link
photo Link
<span class="text-link">
<span>
<a target="_blank" href=https://pikwizard.com/photo/neon-binary-data-streaming-across-tilted-hud-grid-with-red-triangular-pointer-and-cyan-highlights/e44ab0a5fc04994b9564cd71e2ed0803/>PikWizard</a>
</span>
</span>
<span class="image-link">
<span
style="margin: 0 0 20px 0; display: inline-block; vertical-align: middle; width: 100%;"
>
<a
target="_blank"
href="https://pikwizard.com/photo/neon-binary-data-streaming-across-tilted-hud-grid-with-red-triangular-pointer-and-cyan-highlights/e44ab0a5fc04994b9564cd71e2ed0803/"
style="text-decoration: none; font-size: 10px; margin: 0;"
>
<img src="https://thumbs.wbm.im/pw/medium/e44ab0a5fc04994b9564cd71e2ed0803.jpg" style="margin: 0; width: 100%;" alt="Neon binary data streaming across tilted HUD grid with red triangular pointer and cyan highlights" />
<p style="font-size: 12px; margin: 0;">PikWizard</p>
</a>
</span>
</span>
Free (free of charge)
Free for personal and commercial use.
Author: Awesome Content
Similar Free Stock Images


Premium


Premium


Premium


Premium


Premium


Premium


Premium


Premium


Premium


Premium


Premium


Premium


Premium


Premium


Premium


Premium


Premium


Premium


Premium


Premium


Premium


Premium


Premium


Premium


Premium

Explore More Free Stock Images