
- Home >
- Stock Photos >
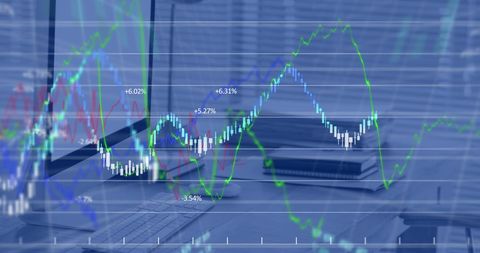
- Financial Data Processing with Global Business Analytics
Financial Data Processing with Global Business Analytics Image

An abstract representation of financial data processing combined with technological elements depicting the global finance market. Graphs and world elements overlay a digital server environment, illustrating concepts of analytics, data management, and high-tech business operations. Ideal for use in materials related to global finance, stock market analysis, business intelligence, and digital infrastructure solutions.
Powered by  - Get 15% off with code: PIKWIZARD15


downloads
Tags:
More
Credit Photo
If you would like to credit the Photo, here are some ways you can do so
Text Link
photo Link
<span class="text-link">
<span>
<a target="_blank" href=https://pikwizard.com/photo/financial-data-processing-with-global-business-analytics/3d6e7c41affe7f1343019f0fb0534db7/>PikWizard</a>
</span>
</span>
<span class="image-link">
<span
style="margin: 0 0 20px 0; display: inline-block; vertical-align: middle; width: 100%;"
>
<a
target="_blank"
href="https://pikwizard.com/photo/financial-data-processing-with-global-business-analytics/3d6e7c41affe7f1343019f0fb0534db7/"
style="text-decoration: none; font-size: 10px; margin: 0;"
>
<img src="https://pikwizard.com/pw/medium/3d6e7c41affe7f1343019f0fb0534db7.jpg" style="margin: 0; width: 100%;" alt="" />
<p style="font-size: 12px; margin: 0;">PikWizard</p>
</a>
</span>
</span>
Free (free of charge)
Free for personal and commercial use.
Author: Authentic Images
Similar Free Stock Images

Premium


Premium


Premium


Premium


Premium


Premium


Premium


Premium


Premium


Premium


Premium


Premium


Premium


Premium


Premium

Premium


Premium


Premium


Premium


Premium


Premium


Premium


Premium


Premium


Premium

Explore More Free Stock Images