1. Home > 
  2. Stock Photos > 
  3. Financial Data Processing with Graphs and Charts Overlay

Financial Data Processing with Graphs and Charts Overlay Image

Financial Data Processing with Graphs and Charts Overlay

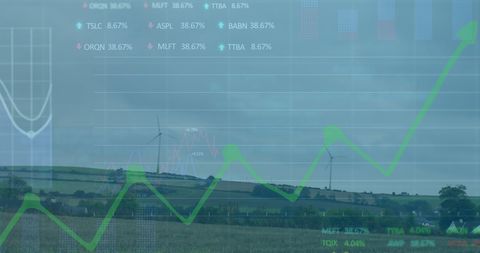
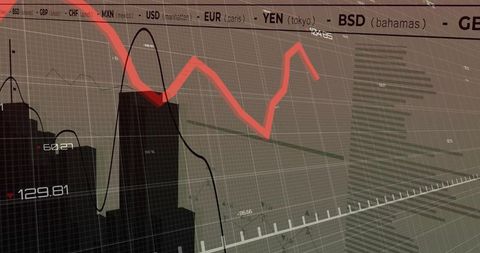
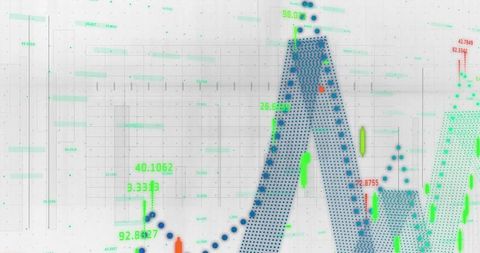
Visual depicts representation of financial data processing with overlapped charts and graphs, useful for presentations on global financial trends, digital analytics software, or data visualization techniques in corporate settings.

Powered by Adobe logo
Business people analyzing financial charts and graphs at meeting - Powered by Adobe
Dynamic blue and green digital stock market graph with bar charts and lines on a dark background, representing financial data analysis, investment trends, business growth, and global economy fluctuat - Powered by AdobeAi generated image of laptop displaying financial data analysis charts and graphs isolated on transparent background - Powered by AdobeAnalyzing real-time financial market trends and stock performance with vibrant candlestick charts and data displayed on a digital screen, symbolizing investment analysis and global economic activity - Powered by AdobeMagnifying glass over financial charts and graphs showing data analysis and growth - Powered by Adobe

Credit Photo

If you would like to credit the Photo, here are some ways you can do so

Free (free of charge)

Free for personal and commercial use.

Author: People Creations

Similar Free Stock Images

Digital Financial Data Analysis with Infographics and Charts
Premium
Professional Latina woman sits at desk in coworking office, focused on her work, looking at computer screen displaying financial charts and stock market data related to trading or financial analysis
Digital Financial Data with Graph and Grid Patterns
Digital Finance: Modern Stock Market Analysis Display
Premium
A business professional engages with financial data on a laptop, surrounded by innovative graphs and charts that signify growth and success in a corporate environment. Scalp
Futuristic Digital Interface with Spiraling Coding Patterns
Digital Financial Data Interface with Analytics
Digital Data Processing with Chart in Futuristic Interface
Digital Financial Data Overlay on Urban Street Scene
Premium
Abstract digital illustration of business growth charts and graphs representing financial data and investment analysis in a futuristic design
Gamepad Icon Overlaid on Financial Data Chart
Cityscape with Digital Stock Market Graphs and Statistics
Dynamic Data Analytics and Forecasting Visualization Graph
Digital Financial Data and AI Illustration Networking Globally
Premium
Futuristic city skyline overlaid with financial charts at night
Financial Data Graph Rendering Global Market Trends
Fluctuating Digital Stock Market Data Chart
Abstract Digital Stock Market Analysis with Graphs
Digital Data Processing with Scope Scanning Interface
Premium
Digital forest data analysis with glowing charts and bar graphs. Abstract concept of environmental economics finance and tech, showing growth and trends in nature.
Dynamic Digital Data Analysis on Elevated Grid
Futuristic data dashboard visualizing analytics with neon grid, line, area and bar charts
Digital Data Visualization and Analysis Interface
Dynamic Financial Charts and Graphs Indicating Market Trends
Premium
Ai generated image of blue financial graph with upward trend isolated on transparent background
Economic and Political Factors Influence Investment Trends
Minimalist Financial Chart Display on Digital Interface with Gold Frame
Abstract Financial Chart Background with Bar and Line Graphs
Abstract Data Network with Red Nodes and Brown Rings
Cryptocurrency Trends and Data Visualization Concept
Digital Data and Arrows Showcasing Market Trends
Futuristic Digital Representation of DNA Strand
Dynamic Financial Data Visualization on Digital Grid Background
Digital Data Visualization on Blue Background
Digital Interface with Data Graphs and Charts
Financial Graphs Overlaying Shopping Bag Representation Economy
Global Financial Data Analysis with Green Growth Arrows on Blue Background
Dynamic Digital Graph Showing Global Data Movement
Premium
Data Examination: A magnifying glass hovers over financial reports and charts on a sky-blue surface, providing an overview of the business analysis.
Premium
Tablet displaying financial data graphs on a dark control panel
Financial Growth Chart Overlaid on Wind Turbine Landscape
Abstract Financial Data Chart with Positive Trends and Percentages
Financial Growth Chart with Data Visualization Elements
Futuristic Financial Data Analysis with Rising White Line Graph
Premium
Manager touches growth graph on analytics dashboard. Business data analysis reports with marketing finance management strategy. Digital charts graphs increase business performance, sales statistic
Data Analysis with Advanced Technology Interface Details Profusion
Displaying pixelated user profile overlaying blue and red trend lines on analytics panel
Financial Data Processing with Digital Patterns for Global Business
City Skyline with Overlay of Financial Market Trends
Premium
AI finance business data analysis digital technology investment trading market stock, financial analyst using advanced holographic interface for global market insight, smart investment strategy
Abstract Financial Graph with Rising Waves on Red Gradient
Financial Data Visualization Over Futuristic Cityscape
Digital Visualization of Global Networking with Statistical Graphs
Rising Digital Graph and Data Visualizations on Black Background
Premium
Business charts graphs analysis with calculator and magnifying glass
Digital Data Flow with Infographics Hologram
Red Downtrend Line Crossing Black Curve on Financial Dashboard with Global Currency Labels
Abstract Visualization of Data Analytics Dashboard with Speech Bubbles
Digital Financial Data Analysis with Graphs and Stock Market Trends
Financial Data Overlay on Urban Skyscrapers
Analyzing Data Trends on Digital Graph Interface
Dynamic Data Visualization Dashboard with Notifications and Alerts
Dynamic Business Data and Cityscape Visualization
Futuristic Data Dashboard with Abstract Waveforms and Light Effects
Premium
Analyzing financial data on a smartphone, with charts and graphs in the background
Digital Financial Dashboard with Graphs and Data Visualization
Financial Data Analysis Vibrant Graphs on Blue Background
Stagflation Text on Bahrain Flag with Rising Graph
Premium
Stethoscope and charts on desk representing healthcare analytics and financial performance
Dynamic Financial Graphs Overlaying Modern Cityscape
Futuristic Data Visualization with Dynamic Graphs and Digital Globe
Rising Financial Data Graph on Digital Grid Background
Candlestick Chart Visualization with Indicators and Growth Highlight
Digital Financial Display with Graphs and Data Analysis
Premium
Analyzing financial charts and data reports in modern office setting
Data Recovery Progress Display on Digital Interface
Rising Graph Line on Digital Green Grid Background
Abstract Data Visualization with Technological Grid Background
Optimized Statistical Data Overlain on Corporate Architecture
Premium
E-commerce sales growth represented by colorful bar charts and financial graphs in a modern corporate environment
Digital Interface Visualizing DNA and Data Patterns
Abstract Digital Charts with Social Media Metrics Rising
Modern Data Analyzing Dashboard with 3D Chart Visualization
Premium
Female expert in glasses looking at screen with financial data
Premium
Trader analyzing financial data on laptop at home office workspace
Financial Data Analysis and Digital Interface Concept
Digital Financial Data Processing Interface on Red Background
Financial Data Flow against Urban Skyline Backdrop
Abstract Digital Finance Chart Showing Fluctuating Graph Lines
Premium
Female professional analyzing business data and financial charts on a laptop screen while working in a modern office environment.
Premium
Business financial chart with moving up arrow graph.Financial data charts with glowing stock market graphs.Stock market investment data and analysis finance graph.
Premium
Business audit stock financial finance management on analysis data strategy with graph accounting marketing or report chart economy investment research profit concept
Digital DNA Strand Visualization on Modern Interface Background
Dynamic Financial Growth Digital Chart Display
Financial Data Charts with World Map on Blue Digital Background
Digital Data Visualization with Trend Lines and Percentage Changes
Premium
Magnifying glass focusing on candlestick chart, showcasing market analysis on a dark background, concept for financial review, investment strategy and business intelligence data analysis
Dynamic Graphs and Charts on Technology Background
Digital Stock Market Trends and Financial Growth Analysis
Interactive Social Media Metrics Overlaid on Business Data Graph
Digital Financial Data Visual Representation on Blue Background
Data Analytics Graphs on Digital Interface Background
Digital Interface with Virtual Data Surging Across Connection Globes
Futuristic Digital Interface with DNA and Brain Diagrams
Premium
Business meeting in progress as two individuals review financial data and colorful graphs displayed on a laptop, with charts and documents around them.
Pulsing Neon Green ECG Waveform on Digital Code Interface
Digital Financial Data and Global Business Analytics
Holographic Financial Stock Market Analysis Visualization
World Map with Digital Data Stream and Processing Interface
Premium
Data Analyst Using Data Analytics KPI
Abstract Data Visualization Graph on Blurred Background
Futuristic Digital Sound Wave on Blue Background
Digital Chart Display Financial Data Analysis Background Effects
Dynamic Financial Data Visualizations on Grid Interface
Dynamic Financial Data Display in Digital Space
Abstract Digital DNA Helix with Geometric Patterns and Nodes
European Market Data Overlay with EU Flag and Financial Graphs
Financial Graphs Overlaying Industrial Junkyard
Abstract Digital Interface with Network Connections and Data Visualizations
Premium
Magnifying glass on charts graphs paper. Financial development, Banking Account, Statistic, Investment Analytic research data economy.
Abstract Neon Digital Waveform on Futuristic Network Background
Dynamic Financial Data Overlaid on Grid Background
Green Graph with Thumbs-Up Notifications Symbolizing Positive Data Trends
Digital Stock Market Graph Red Trendline on Green Background
Premium
Financial market data analysis with glowing 3D bar and line charts on dark background showing economic trends and growth concept visualization. 3D Rendering
Explore More Free Stock Images