1. Home > 
  2. Stock Photos > 
  3. Financial Data Projection in Modern Office Space

Financial Data Projection in Modern Office Space Image

Financial Data Projection in Modern Office Space

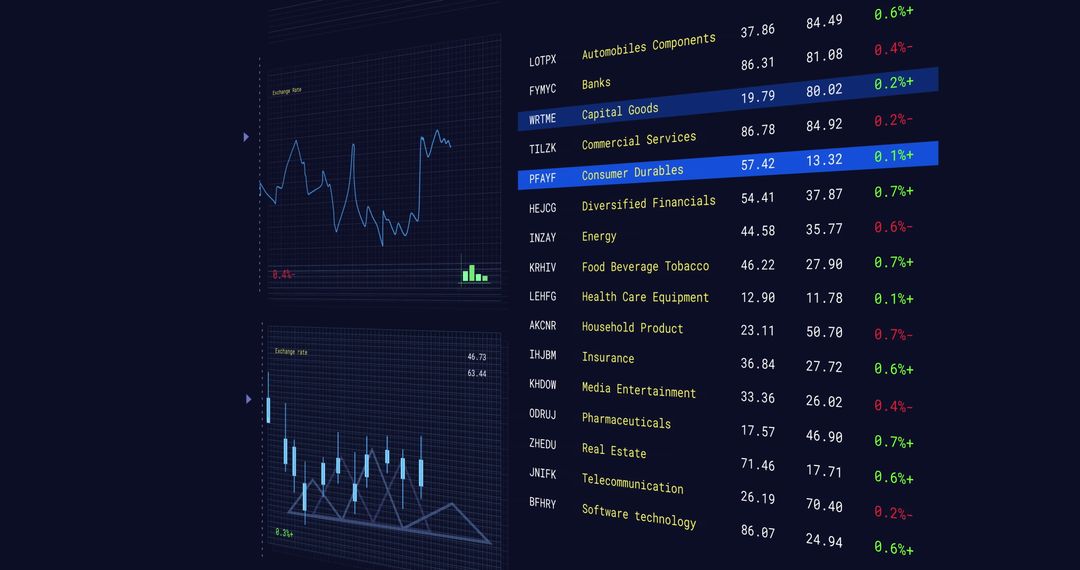
Digital data graphs and charts projecting over an empty office environment. Ideal for visualizing modern technology in financial analysis, business strategy presentations, and investment newsletters. Illustrates financial data monitoring and analytics in a futuristic office setting.

Powered by Adobe logo
Cash Flow management concept in modern business finance — professional using futuristic digital interface symbolizing income tracking, financial liquidity, budgeting, and corporate accounting - Powered by AdobeDynamic futuristic digital interface showcasing complex data analytics and network connections with vibrant glowing charts and graphs in a modern dark room - Powered by AdobeDigital banking concept with hologram interface showing finance icons and technology interaction on futuristic background in innovation context. - Powered by AdobeRetail store displaying futuristic data analytics interface - Powered by AdobeBusiness background abstract isometric financial dashboard interface data charts 3D graphs glowing icons and digital analysis visuals no people - Powered by Adobe

Credit Photo

If you would like to credit the Photo, here are some ways you can do so

Free (free of charge)

Free for personal and commercial use.

Author: People Creations

Similar Free Stock Images

Financial Data and Graphs on Digital Screen
Premium
Magnifying glass is on a black background with a red and blue line
Data Processing and Statistics Visualization in Server Room
Digital Financial Data Analyzing with Bar and Line Graphs on Screen
Financial Visualization Overlooking Urban Cityscape
Dynamic Stock Market Analytics Display on Blue Background
Premium
A business professional analyzing futuristic digital graphs and analytics dashboards on a tablet, showcasing data visualization, financial growth, and business intelligence in a modern tech environmen
Financial Data Display in Digital Grid Design
Data Processing and Cloud Computing Server Room Visualization
Digital Interface of Data Processing Over Cityscape
Diverse Graphs and Data Over Urban Landscape
Premium
a world map made of glowing lines and nodes, floating in space, connected cities and data streams, powerful and futuristic, ideal for global brand ads, cinematic 16:9
Global Financial Trends and Digital Data Visualization Concepts
Holographic Financial Data Visualization with Stock Trends
Complex Financial Graphs Showing Market Changes and Data Analysis
Stock Market Analysis Digital Screen with Graphs and Trends
Premium
Laptop screen displaying financial data charts.
Dynamic Stock Market Analysis on Digital Screen
Dynamic Stock Market Data Analysis With Graphs and Percentages
Dynamic Data Analytics Interface Showing Statistical Trends
Financial Growth Chart with Digital Data Interface
Premium
Dynamic futuristic digital interface showcasing complex data analytics and network connections with vibrant glowing charts and graphs in a modern dark room
Futuristic Financial Data Analysis with Graphs and Charts
Global Financial Data with Dynamic Analytics Visualization
Digital Stock Market Data and Financial Charts Interface
Futuristic Stock Market Graphs on Digital Display
Premium
Man in checkered shirt interacting with a holographic digital data interface displaying financial charts and analytics showing progress and growth Analysis
Modern Data Dashboard Display with Interactive Charts
Dynamic Financial Graphs and Dashboard Analytics
Financial Analytics Dashboard with Growth Trends and Indicators
Digital Dashboard Displaying Financial Chart and Analytics Interface
Colorful Stock Market Display with Graphs and Tickers on Blue Background
Dynamic Digital Stock Market Ticker with Growing Graph Trends
Premium
Woman interacts with a futuristic digital interface displaying financial data
Financial Data Visualization in Modern Digital Display Office
Financial Data Analytics on Digital Interface Displaying Graphs
Financial Graphs with Cityscape Background Reflecting Market Trends
Digital Interface Displaying Stock Market Data and Statistics
Premium
Modern financial technology solution with artificial intelligence for digital wallet
Analyzing Financial Market Trends with Data Visualization
Digital Financial Data Analysis with Infographics and Charts
Overlay of Financial Data on Business People in Office Building
Analyzing Stock Market Data Trends with Futuristic Visuals
Premium
Futuristic bank icon being selected on a digital interface. Online banking, technology, and modern financial solutions represented here.
Stock Market Graph and Data Analysis
Data Analytics with Dynamic Global Market Trends on Screen
Dynamic Financial Data Visual Display with Graph Annotations
Holographic Financial Stock Market Analysis Visualization
Premium
A close-up of a digital screen displaying various data charts, graphs, and analytics in a modern office environment.
Fluctuating Stock Market Data on Digital Screen
Financial Data Analysis and Global Market Trends
Dynamic Financial Data with Global Connections and Insights
Stock Market Analysis with Graphs and Trading Data
Premium
Businessman holding magnifying glass over digital audit interface with flowchart legal scales, for compliance, verification, financial review, data analysis in modern technology environment
Dynamic Financial Data Growth Chart Display
Dynamic Global Financial Data with Multicolored Graph Lines
FinTech Global Data Chart with Statistical Analysis
Financial Growth Chart Data Analysis with Global Trends
Premium
Man looking at digital data
Stock Market Dashboard with Analytics and Graphs
Digital Candlestick Chart with Percentages and Analytics Lines
Digital Code Interface with Graphs on Blue Background
Stock Market Trends Visual with Growth Charts on Black Background
Digital Financial Data Interface with Analytics
Financial Data Streaming with Arrows Over Graphic Indicators
Premium
Seamless cloud data management on smartphone modern business technology interface
Digital Stock Market Data and Analytics on Screen
Dynamic Stock Market Data Display with Charts and Numbers
Digital Ruble Symbol with Data Graph Overlay
Digital Interface With Cityscape And Financial Data Charts
Premium
Professional touches a glowing arrow showing business financial growth and success in futuristic digital data environment
Dynamic Business Analysis with Global Digital Interface Figures
Digital Financial Data Display Tracking Market Trends
Digitized Financial Data Analysis with Graphs and Codes
Holographic Stock Market Analysis with Charts and Data
Premium
Futuristic digital dashboard with glowing real estate data, property market trends, and analytics in modern office environment
Financial Data Visualization with Graphs and Charts on Navy Background
Abstract Digital Stock Market Interface with Graphs and Data
Finance and Technology Theme with Stock Market Data Overlay
Transforming Data and Financial Analysis on Pink Graph
Premium
Futuristic digital graphs and financial business charts panels
Financial Data Visualization with Increasing Graph Trend
Data Processing Overlaid on Graphs and Code in Digital Interface
Colorful Data Analytics Display on Dark Background
Digital Data Processing with Technology Interface on Blue Background
Premium
Modern smartphone displaying holographic financial analytics interface for mobile business data management and insights.
Digital Financial Data Analysis on Abstract Blue Background
Dynamic Financial Graph with Data Analysis Conceptual Background
Financial Data Processing on Digital Graph Displayed on Screen
Dynamic Financial Data Graph Illustrating Stock Market Trends
Premium
Dynamic chart displaying financial data trends with colorful lights and digital effects for modern analysis.
Digital Financial Dashboard with Cyan Bar and Red Line Graph
Cyber Analytics Dashboard Showing Multicolor Waveforms on Neon Cyan Grid Interface
Dynamic Stock Market Trends with Graphs on Digital Display
Digital Financial Data Stream with Numeric Overlay
Digital Financial Data with Trending Arrows
Futuristic Financial Data Analytics with Digital Interface Concept
Premium
modern digital banking security concept with holographic bank shield symbol and futuristic financial technology icons on a touchscreen interface
Financial Data Analysis on Digital Display
Dynamic Financial Data and Graphs on Digital Interface
Digital Financial Data Interface on Green Background
Dynamic Financial Data Charts on Dark Digital Background
Premium
Businessman interacting with digital currency symbols and financial icons in a modern setting
Digital Data Visualization with Futuristic Infographics
Dynamic Statistical Data Analysis on Digital Grid Network
Digital Financial Graphs and Market Data Analysis
Financial Graphs Overlaying Cityscape Illustrate Global Economy
Premium
Dynamic stock market graph with vibrant blue and purple hues, showcasing upward trends and financial data visualization in a modern digital interface.
Abstract Digital Stock Market Analysis with Graphs
Dynamic Financial Data Graphed Over Digital Grid
Global Financial Data Processing with Digital Interface Elements
Dynamic Stock Market Graph with Percentage Indicators
Premium
Corporate Tax concept in financial management — business professional using futuristic digital interface symbolizing accounting compliance, tax regulation, and digital finance system
Digital Display of Financial Data with Graph and Figures
Financial Data Analysis with Growing Stock Trends
Digital Financial Data Visualization on Dark Screen
Dynamic Financial Graph Displaying Market Trends
Premium
Protecting digital assets with advanced security and dynamic financial analytics, showcasing robust cybersecurity and business growth strategies visualized in a futuristic interface
Data Analytics with Stock Market Chart Display
Financial Analytics Dashboard with Dynamic Charts and Script Display
Financial Analytics Dashboard with Trend Lines and Data Visualization
Digital Financial Analytics Dashboard Displaying Diverse Data Visualizations
Premium
Data center servers with cityscape view. Financial graph and dashboard interface over blur city. Global business and technology internet connection.
Displaying financial market trends with blue and red line charts, dotted histogram columns and perce