
- Home >
- Stock Photos >
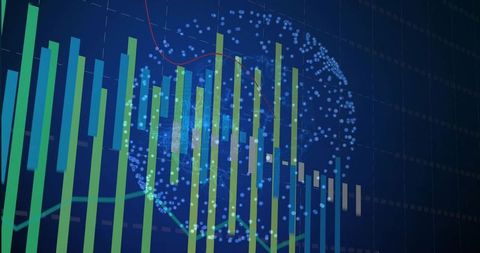
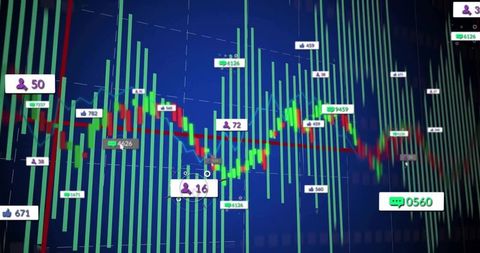
- Financial Data Visualization with Chart Analysis and Big Data
Financial Data Visualization with Chart Analysis and Big Data Image

Text showing concept of analyzing financial data and interpreting trends within stock markets. Specialists in finance, investment analysis, and data science might use this to emphasize big data capabilities in presentations, reports, or articles on stock market patterns and predictions.
Powered by  - Get 15% off with code: PIKWIZARD15


downloads
Tags:
More
Credit Photo
If you would like to credit the Photo, here are some ways you can do so
Text Link
photo Link
<span class="text-link">
<span>
<a target="_blank" href=https://pikwizard.com/photo/financial-data-visualization-with-chart-analysis-and-big-data/3b2e95fbf71d8b6a9585f86c34d3e667/>PikWizard</a>
</span>
</span>
<span class="image-link">
<span
style="margin: 0 0 20px 0; display: inline-block; vertical-align: middle; width: 100%;"
>
<a
target="_blank"
href="https://pikwizard.com/photo/financial-data-visualization-with-chart-analysis-and-big-data/3b2e95fbf71d8b6a9585f86c34d3e667/"
style="text-decoration: none; font-size: 10px; margin: 0;"
>
<img src="https://pikwizard.com/pw/medium/3b2e95fbf71d8b6a9585f86c34d3e667.jpg" style="margin: 0; width: 100%;" alt="" />
<p style="font-size: 12px; margin: 0;">PikWizard</p>
</a>
</span>
</span>
Free (free of charge)
Free for personal and commercial use.
Author: Creative Art
Similar Free Stock Images

Premium


Premium


Premium


Premium


Premium


Premium

Premium


Premium


Premium


Premium


Premium


Premium

Premium

Premium


Premium


Premium


Premium


Premium


Premium


Premium


Premium


Premium


Premium

Premium

Premium


Explore More Free Stock Images