
- Home >
- Stock Photos >
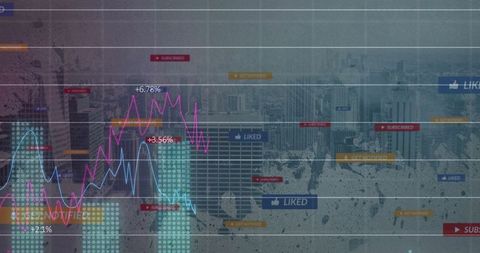
- Financial Data Visualization with Charts and Graphs on Dashboard
Financial Data Visualization with Charts and Graphs on Dashboard Image

Depicts intricate financial data actively plotted through various elements like candlestick and line graphs, blending technology with analytics. Suitable for use in presentations, articles about financial markets, online courses on investment strategies or financial software. Versatile for backgrounds, emphasizing dynamic data tracking and visualization.
Powered by  - Get 15% off with code: PIKWIZARD15


downloads
Tags:
More
Credit Photo
If you would like to credit the Photo, here are some ways you can do so
Text Link
photo Link
<span class="text-link">
<span>
<a target="_blank" href=https://pikwizard.com/photo/financial-data-visualization-with-charts-and-graphs-on-dashboard/2a7daeeb529ccf99a9b517d385cadcc9/>PikWizard</a>
</span>
</span>
<span class="image-link">
<span
style="margin: 0 0 20px 0; display: inline-block; vertical-align: middle; width: 100%;"
>
<a
target="_blank"
href="https://pikwizard.com/photo/financial-data-visualization-with-charts-and-graphs-on-dashboard/2a7daeeb529ccf99a9b517d385cadcc9/"
style="text-decoration: none; font-size: 10px; margin: 0;"
>
<img src="https://pikwizard.com/pw/medium/2a7daeeb529ccf99a9b517d385cadcc9.jpg" style="margin: 0; width: 100%;" alt="" />
<p style="font-size: 12px; margin: 0;">PikWizard</p>
</a>
</span>
</span>
Free (free of charge)
Free for personal and commercial use.
Author: Awesome Content
Similar Free Stock Images
Loading...

Premium


Premium


Premium


Premium


Premium

Premium


Premium

Premium


Premium


Premium


Premium

Premium


Premium


Premium


Premium

Premium

Premium


Premium


Premium

Premium

Premium

Premium


Premium


Premium

Premium
