- Home >
- Stock Photos >
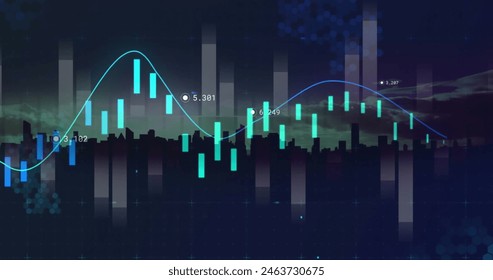
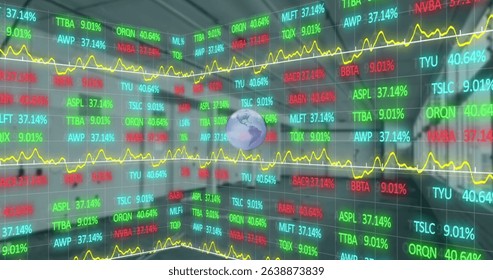
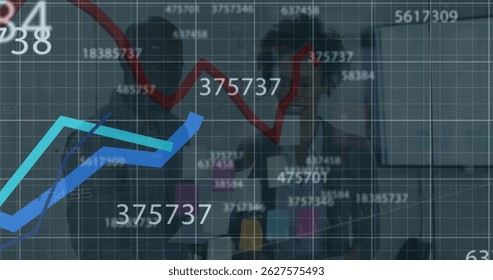
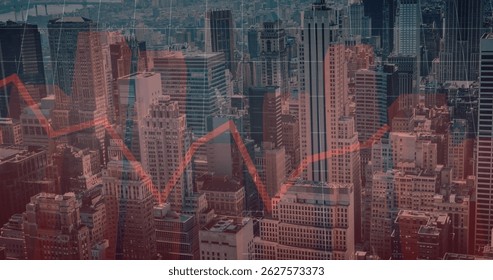
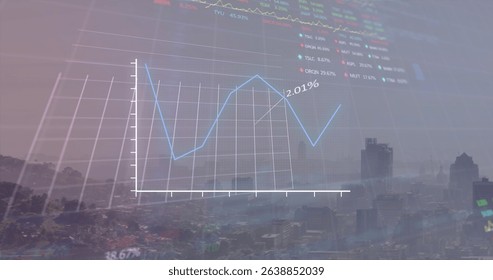
- Financial Graph and Cityscape Analysis with Technological Overlay
Financial Graph and Cityscape Analysis with Technological Overlay Image

Combining dynamic financial graphs with a cityscape represents the interplay of urban development and financial markets, emphasizing technological influence. Suitable for use in business presentations, economic forecasting, financial analysis, technology websites, or articles discussing urbanization's impact on economies, conveying the complexity and interconnectedness of modern finance and cities.
Powered by  - Get 15% off with code: PIKWIZARD15


2
downloads
downloads
Tags:
More
Credit Photo
If you would like to credit the Photo, here are some ways you can do so
Text Link
photo Link
<span class="text-link">
<span>
<a target="_blank" href=https://pikwizard.com/photo/financial-graph-and-cityscape-analysis-with-technological-overlay/c7bc821bbb78a4a0005a27f52655b1a8/>PikWizard</a>
</span>
</span>
<span class="image-link">
<span
style="margin: 0 0 20px 0; display: inline-block; vertical-align: middle; width: 100%;"
>
<a
target="_blank"
href="https://pikwizard.com/photo/financial-graph-and-cityscape-analysis-with-technological-overlay/c7bc821bbb78a4a0005a27f52655b1a8/"
style="text-decoration: none; font-size: 10px; margin: 0;"
>
<img src="https://pikwizard.com/pw/medium/c7bc821bbb78a4a0005a27f52655b1a8.jpg" style="margin: 0; width: 100%;" alt="" />
<p style="font-size: 12px; margin: 0;">PikWizard</p>
</a>
</span>
</span>
Free (free of charge)
Free for personal and commercial use.
Author: Awesome Content
Similar Free Stock Images

Premium


Premium


Premium


Premium


Premium


Premium


Premium


Premium


Premium


Premium


Premium


Premium


Premium


Premium


Premium


Premium


Premium


Premium


Premium


Premium


Premium


Premium


Premium


Premium