- Home >
- Stock Photos >
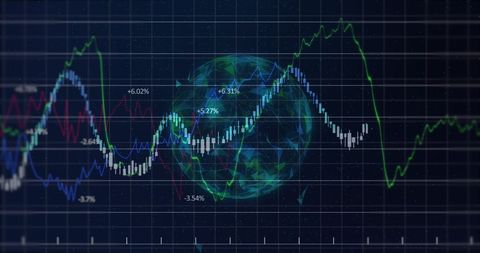
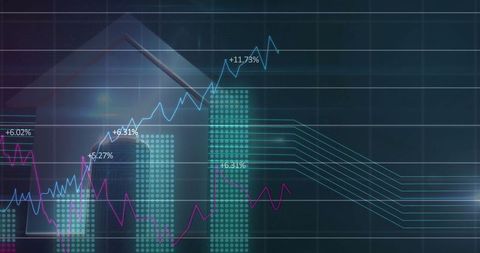
- Financial Growth Chart with Data Visualization Elements
Financial Growth Chart with Data Visualization Elements Image

Features data visualization on a financial dashboard, marked by blue and red lines and bars that signify percent changes. Useful for presentations on financial growth, investment strategies, or educational materials analyzing market trends and data analytics.

downloads
Tags:
More
Credit Photo
If you would like to credit the Photo, here are some ways you can do so
Text Link
photo Link
<span class="text-link">
<span>
<a target="_blank" href=https://pikwizard.com/photo/financial-growth-chart-with-data-visualization-elements/506771b3d931a9fbdc621b462a5e4d24/>PikWizard</a>
</span>
</span>
<span class="image-link">
<span
style="margin: 0 0 20px 0; display: inline-block; vertical-align: middle; width: 100%;"
>
<a
target="_blank"
href="https://pikwizard.com/photo/financial-growth-chart-with-data-visualization-elements/506771b3d931a9fbdc621b462a5e4d24/"
style="text-decoration: none; font-size: 10px; margin: 0;"
>
<img src="https://pikwizard.com/pw/medium/506771b3d931a9fbdc621b462a5e4d24.jpg" style="margin: 0; width: 100%;" alt="" />
<p style="font-size: 12px; margin: 0;">PikWizard</p>
</a>
</span>
</span>
Free (free of charge)
Free for personal and commercial use.
Author: Awesome Content