- Home >
- Stock Photos >
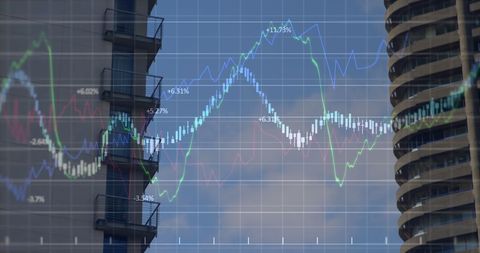
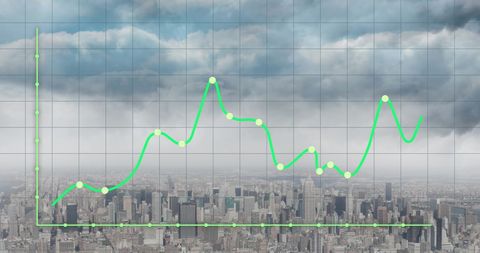
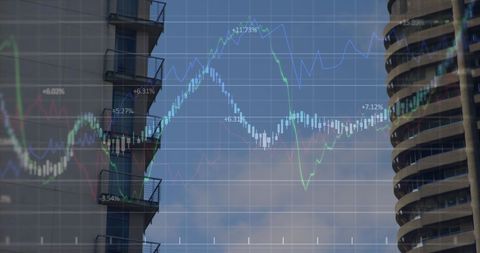
- Financial Growth Statistic Data Processing Over Urban Cityscape
Financial Growth Statistic Data Processing Over Urban Cityscape Image

Overlay of financial graphs on city background, depicting growth and market trends. Ideal for illustrating investment analytics, stock market analysis, and financial news articles. Useful in financial reports, business journals or economic forecasting content.

downloads
Tags:
More
Credit Photo
If you would like to credit the Photo, here are some ways you can do so
Text Link
photo Link
<span class="text-link">
<span>
<a target="_blank" href=https://pikwizard.com/photo/financial-growth-statistic-data-processing-over-urban-cityscape/06bdddd83b2934dca9ea7de91d461509/>PikWizard</a>
</span>
</span>
<span class="image-link">
<span
style="margin: 0 0 20px 0; display: inline-block; vertical-align: middle; width: 100%;"
>
<a
target="_blank"
href="https://pikwizard.com/photo/financial-growth-statistic-data-processing-over-urban-cityscape/06bdddd83b2934dca9ea7de91d461509/"
style="text-decoration: none; font-size: 10px; margin: 0;"
>
<img src="https://pikwizard.com/pw/medium/06bdddd83b2934dca9ea7de91d461509.jpg" style="margin: 0; width: 100%;" alt="" />
<p style="font-size: 12px; margin: 0;">PikWizard</p>
</a>
</span>
</span>
Free (free of charge)
Free for personal and commercial use.
Author: Awesome Content