- Home >
- Stock Photos >
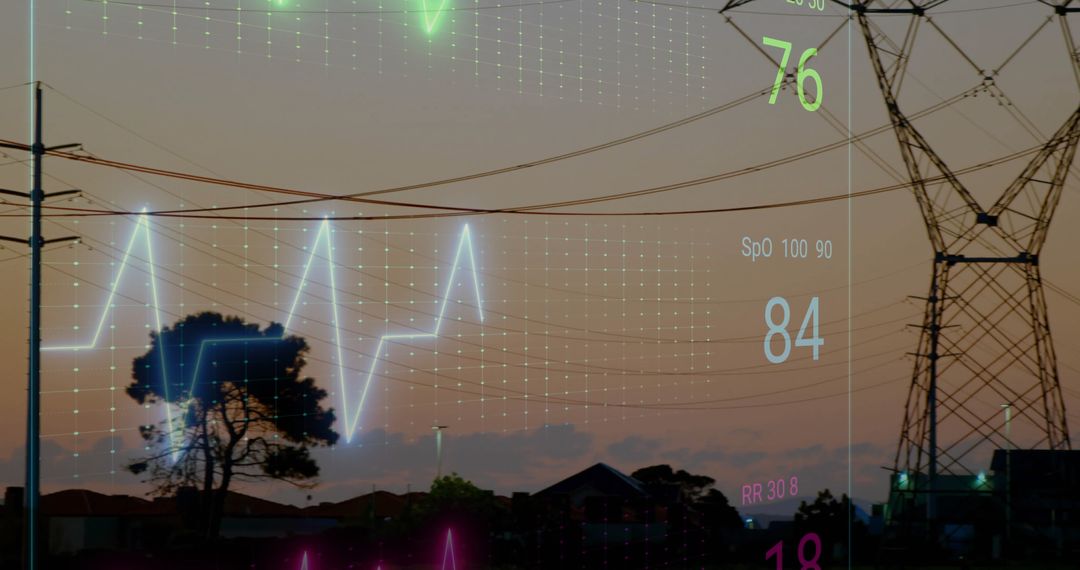
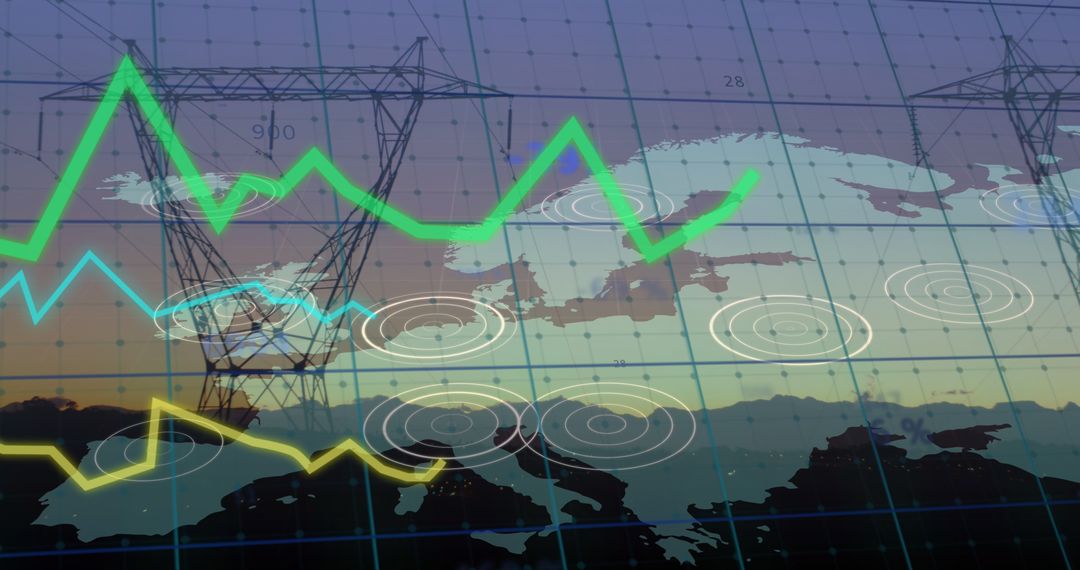
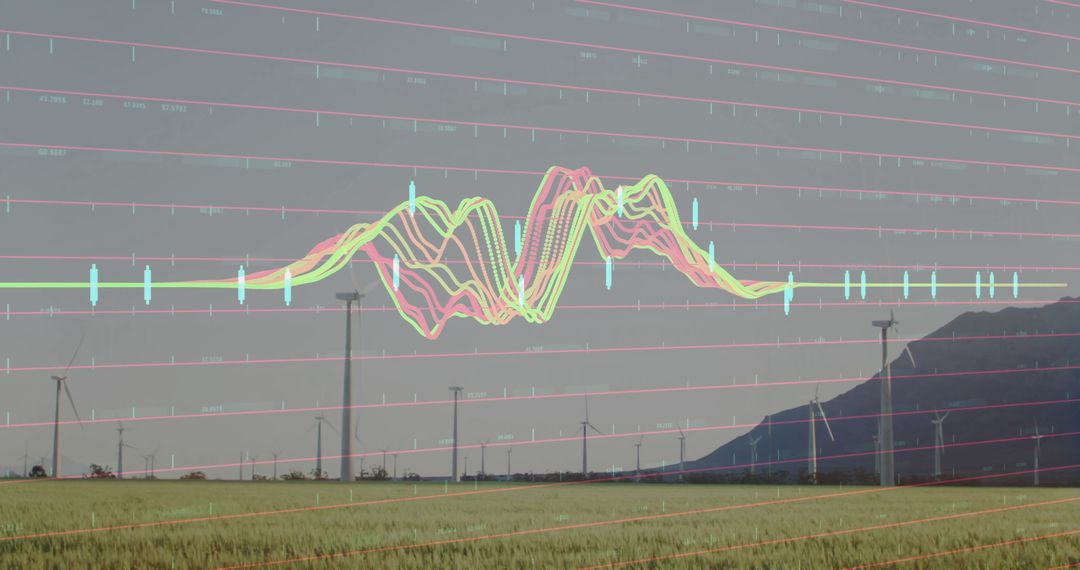
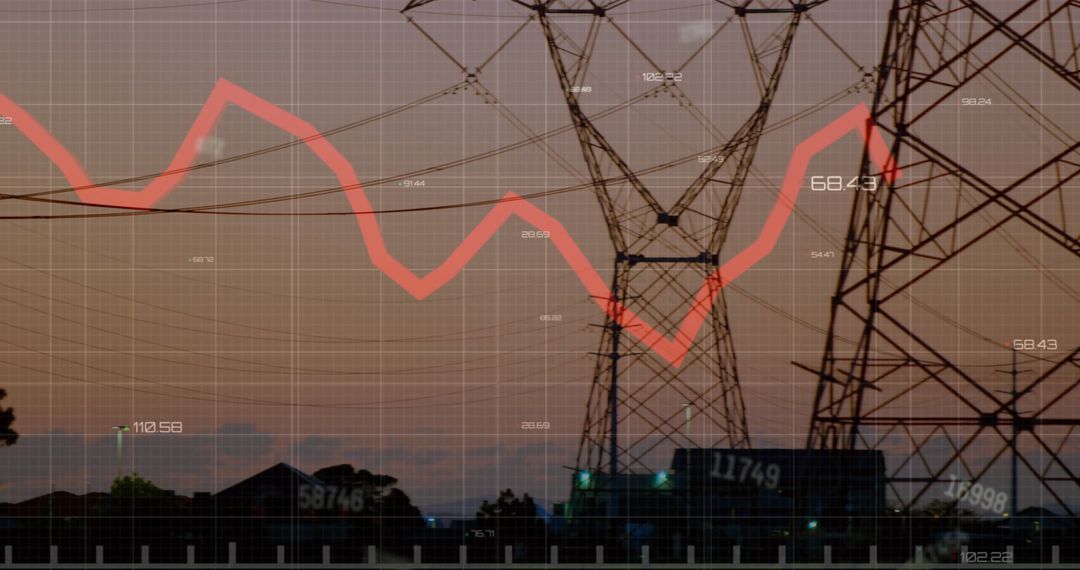
- Financial Statistics Overlaying Utility Towers at Dusk
Financial Statistics Overlaying Utility Towers at Dusk Image
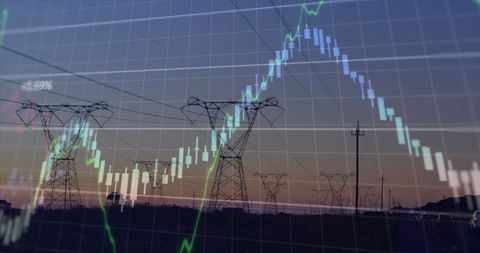
A captivating image of financial data overlays intersecting with utility towers beneath a dusk sky symbolizes the merger of finance and modern technology. The technological and electrical elements reflect themes of infrastructure, networking, and calculation intensity, while the declining stock market graphs introduce an aspect of economic volatility. This image can be used for publications, financial reports, energy industry insights, investment brochures, corporate announcements, or as a metaphor illustrating innovation in sectors powered by technology.
Powered by 


2
downloads
downloads
Tags:
More
Credit Photo
If you would like to credit the Photo, here are some ways you can do so
Text Link
photo Link
<span class="text-link">
<span>
<a target="_blank" href=https://pikwizard.com/photo/financial-statistics-overlaying-utility-towers-at-dusk/6a80c60da90653ffe1725b37c27b4e57/>PikWizard</a>
</span>
</span>
<span class="image-link">
<span
style="margin: 0 0 20px 0; display: inline-block; vertical-align: middle; width: 100%;"
>
<a
target="_blank"
href="https://pikwizard.com/photo/financial-statistics-overlaying-utility-towers-at-dusk/6a80c60da90653ffe1725b37c27b4e57/"
style="text-decoration: none; font-size: 10px; margin: 0;"
>
<img src="https://pikwizard.com/pw/medium/6a80c60da90653ffe1725b37c27b4e57.jpg" style="margin: 0; width: 100%;" alt="" />
<p style="font-size: 12px; margin: 0;">PikWizard</p>
</a>
</span>
</span>
Free (free of charge)
Free for personal and commercial use.
Author: Awesome Content
Similar Free Stock Images

Premium


Premium


Premium


Premium


Premium


Premium


Premium


Premium


Premium


Premium


Premium


Premium


Premium


Premium


Premium


Premium


Premium


Premium


Premium


Premium


Premium


Premium


Premium


Premium