- Home >
- Stock Photos >
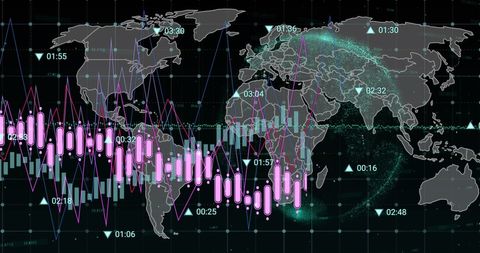
- Financial Trading Chart Overlaying World Map with Red Trend Line
Financial Trading Chart Overlaying World Map with Red Trend Line Image

Visual represents global financial trading data with a red trend line and white bars on a world map. Useful for illustrating international market trends, financial analysis, economic reports, and technology-driven finance insights. Ideal for presentations on global finance topics.
Powered by  - Get 15% off with code: PIKWIZARD15


0
downloads
downloads
Tags:
More
Credit Photo
If you would like to credit the Photo, here are some ways you can do so
Text Link
photo Link
<span class="text-link">
<span>
<a target="_blank" href=https://pikwizard.com/photo/financial-trading-chart-overlaying-world-map-with-red-trend-line/f12c3b39e30de79119990617589cdfba/>PikWizard</a>
</span>
</span>
<span class="image-link">
<span
style="margin: 0 0 20px 0; display: inline-block; vertical-align: middle; width: 100%;"
>
<a
target="_blank"
href="https://pikwizard.com/photo/financial-trading-chart-overlaying-world-map-with-red-trend-line/f12c3b39e30de79119990617589cdfba/"
style="text-decoration: none; font-size: 10px; margin: 0;"
>
<img src="https://pikwizard.com/pw/medium/f12c3b39e30de79119990617589cdfba.jpg" style="margin: 0; width: 100%;" alt="" />
<p style="font-size: 12px; margin: 0;">PikWizard</p>
</a>
</span>
</span>
Free (free of charge)
Free for personal and commercial use.
Author: Awesome Content