- Home >
- Stock Photos >
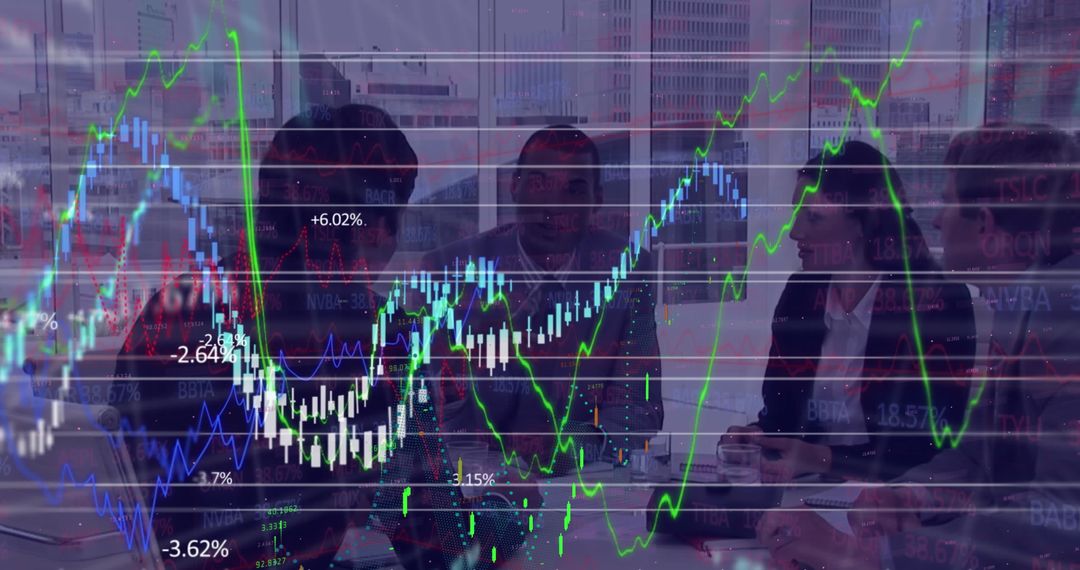
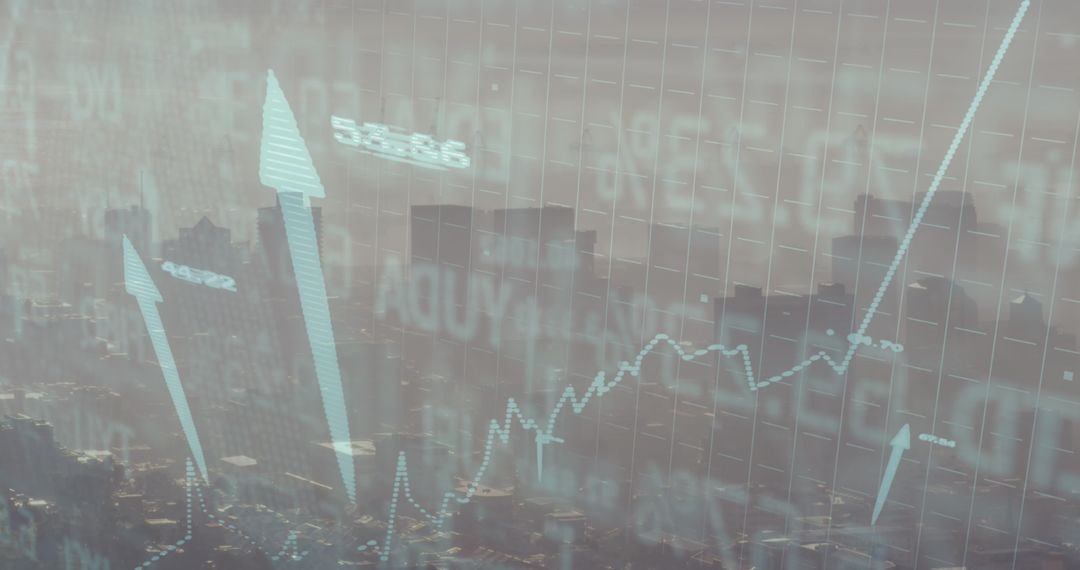
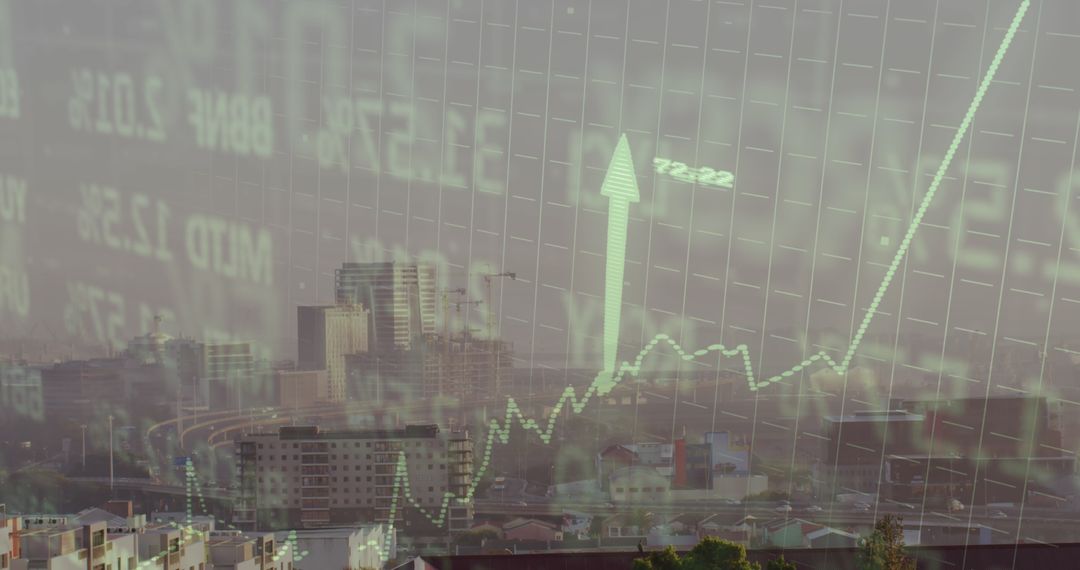
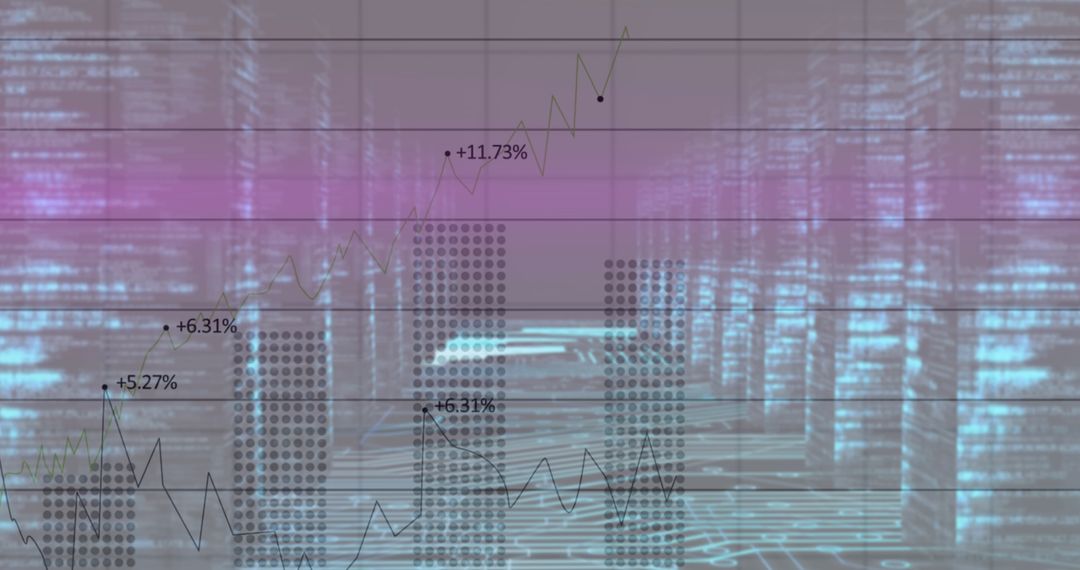
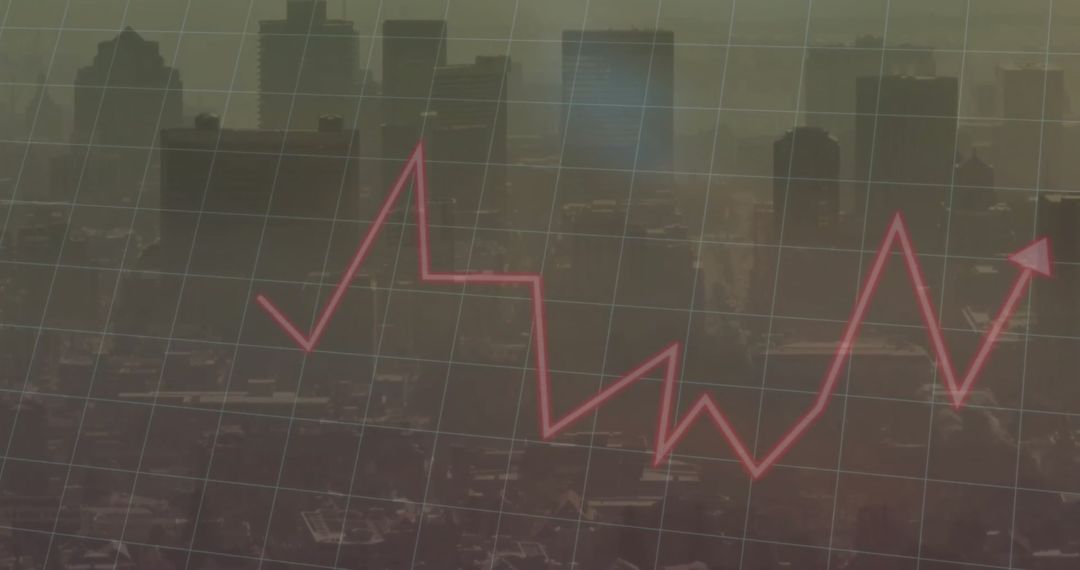
- Financial Trading Data with Arrows and Graphs on Digital Screen
Financial Trading Data with Arrows and Graphs on Digital Screen Image
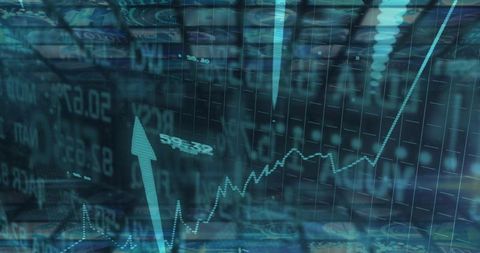
Digital display of financial trading data illustrating a dynamic graph with an upward arrow, indicating market trends or stock performance. This image can be utilized for articles or presentations related to finance, investment strategies, market analysis, fintech advancements, or stock market insights. The digital and technological theme supports modern fintech applications and educational purposes.
Powered by  - Get 15% off with code: PIKWIZARD15


0
downloads
downloads
Tags:
More
Credit Photo
If you would like to credit the Photo, here are some ways you can do so
Text Link
photo Link
<span class="text-link">
<span>
<a target="_blank" href=https://pikwizard.com/photo/financial-trading-data-with-arrows-and-graphs-on-digital-screen/81c824748bd4b0b798a3a10d7421531a/>PikWizard</a>
</span>
</span>
<span class="image-link">
<span
style="margin: 0 0 20px 0; display: inline-block; vertical-align: middle; width: 100%;"
>
<a
target="_blank"
href="https://pikwizard.com/photo/financial-trading-data-with-arrows-and-graphs-on-digital-screen/81c824748bd4b0b798a3a10d7421531a/"
style="text-decoration: none; font-size: 10px; margin: 0;"
>
<img src="https://pikwizard.com/pw/medium/81c824748bd4b0b798a3a10d7421531a.jpg" style="margin: 0; width: 100%;" alt="" />
<p style="font-size: 12px; margin: 0;">PikWizard</p>
</a>
</span>
</span>
Free (free of charge)
Free for personal and commercial use.
Author: People Creations
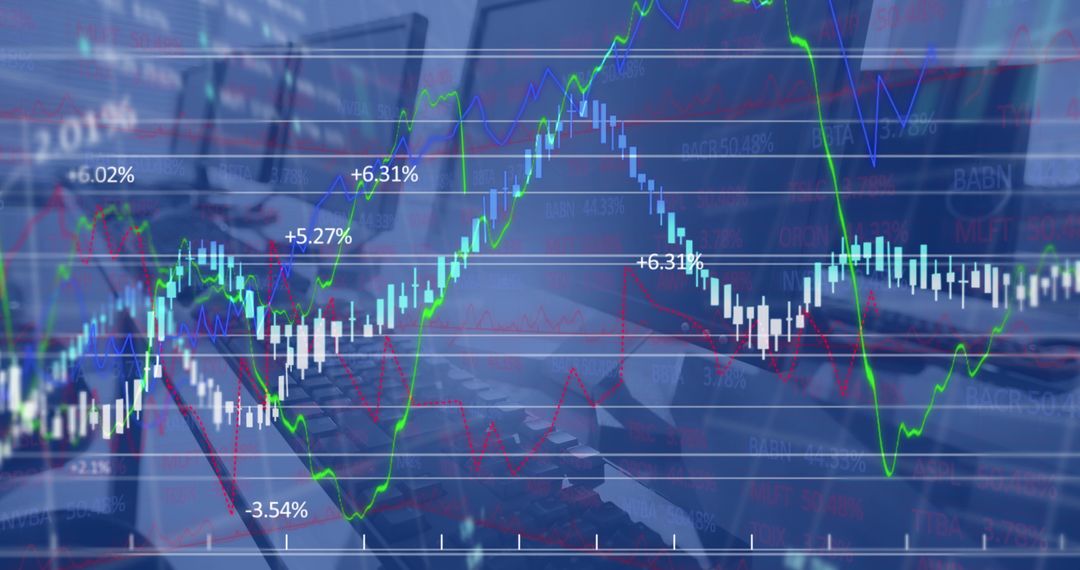
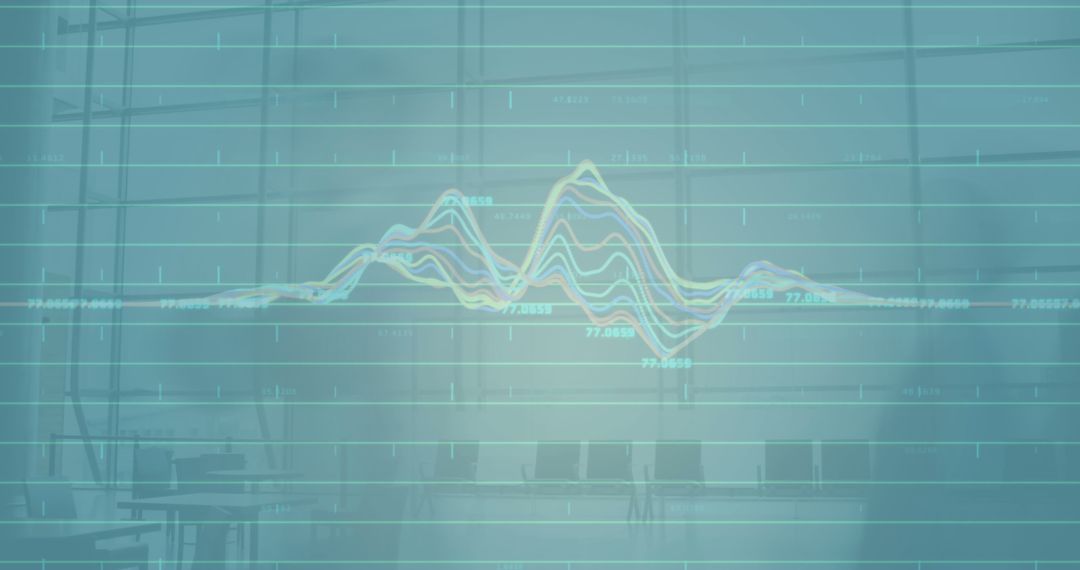
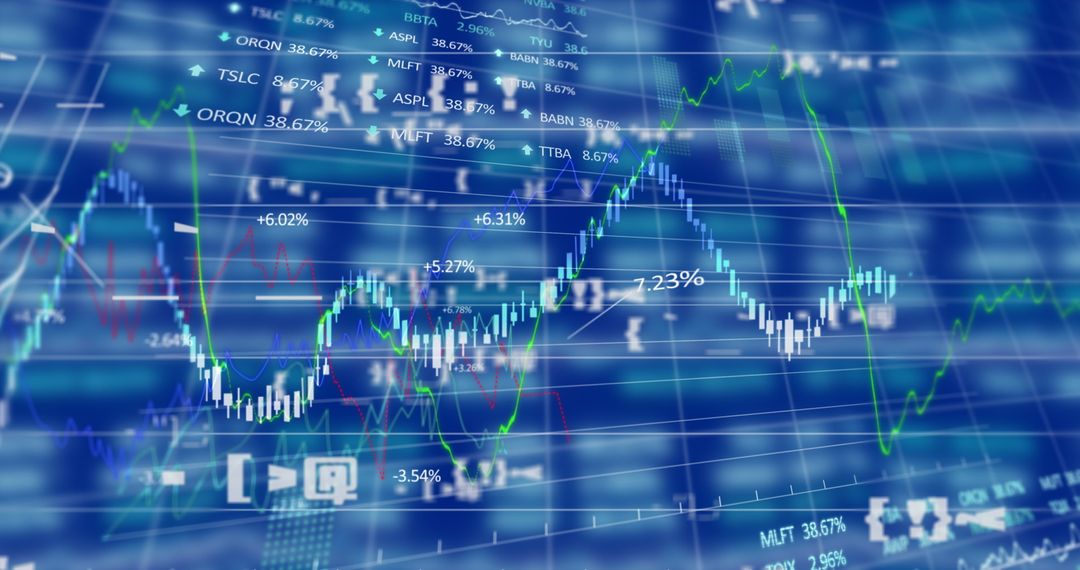
Similar Free Stock Images

Premium


Premium


Premium


Premium


Premium


Premium


Premium


Premium


Premium


Premium


Premium


Premium


Premium


Premium


Premium


Premium


Premium


Premium


Premium


Premium


Premium


Premium


Premium


Premium